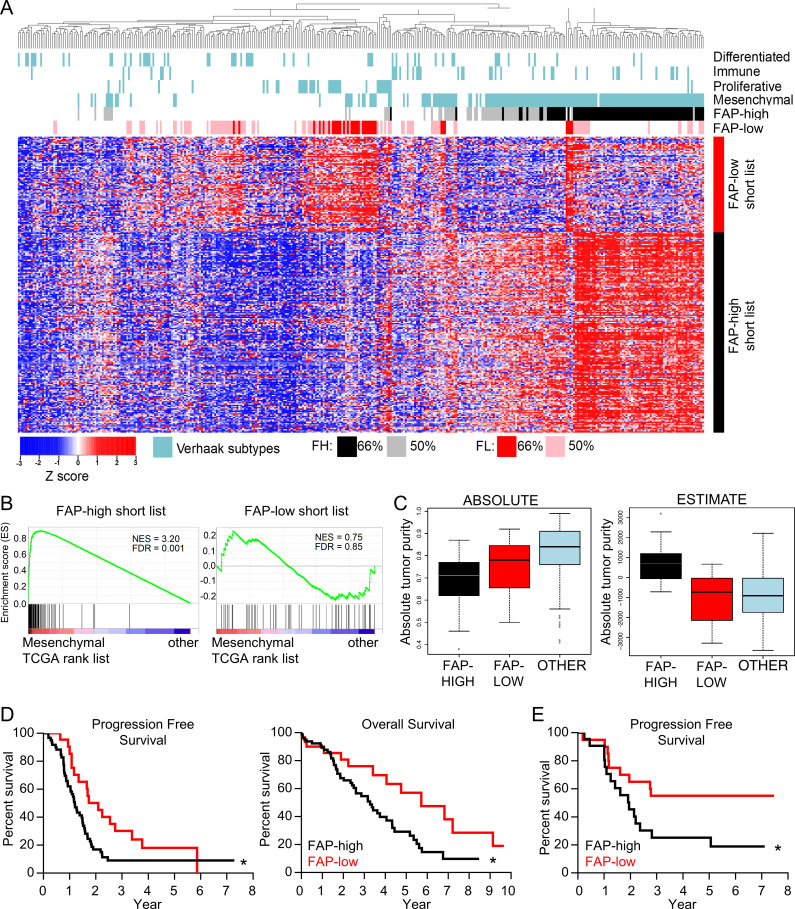
Figure 4.
FAP-high patients correspond to the mesenchymal molecular subtype and have worse clinical outcomes than FAP-low patients. (A) Heatmap of TCGA HGSOC data showing unsupervised clustering of patients using the FAP-high (FH) and FAP-low (FL) specific CAF gene lists. The TCGA molecular subtypes (Verhaak et al., 2013) are shown above the heatmap in blue. Patients expressing either 75% or 50% of the FAP-high signature genes are indicated in black and gray, respectively. Patients expressing either 75% or 50% of the FAP-low signature genes are indicated in red and pink, respectively. (B) GSEA comparing the FAP-high (left) and FAP-low (right) gene lists to the genes expressed in TCGA mesenchymal subtype. (C) The ABSOLUTE (left) and ESTIMATE (right) algorithms were applied to patients falling into the FAP-high (black), FAP-low (red), and “other” (blue) categories of patients selected using the more stringent 75% cutoff. (D) Kaplan–Meier survival curves of patients falling into the FAP-high (n = 80) and FAP-low (n = 30) groups (based on the 75% cutoff). Median progression-free survival was 1.2 yr for FAP-high and 2.1 yr for FAP-low patients; log-rank P value = 0.0204; hazard ratio (HR) = 1.89; 95% confidence interval (CI), 1.11–2.97. Median overall survival was 3.3 yr for FAP-high and 5.7 yr for FAP-low patients; log-rank P value = 0.0236, HR (95% CI) = 1.95 (1.11–3.24). (E) Kaplan–Meier progression-free survival curve of patients from our center that were profiled by FC for the proportion of CD49e+ CAFs that were positive for FAP staining. Patients were separated into FAP-high and FAP-low based on the median FAP expression. Log-rank P value = 0.041, HR (95% CI) = 2.28 (1.04–5.05). See Table S1 B for recurrence data.

