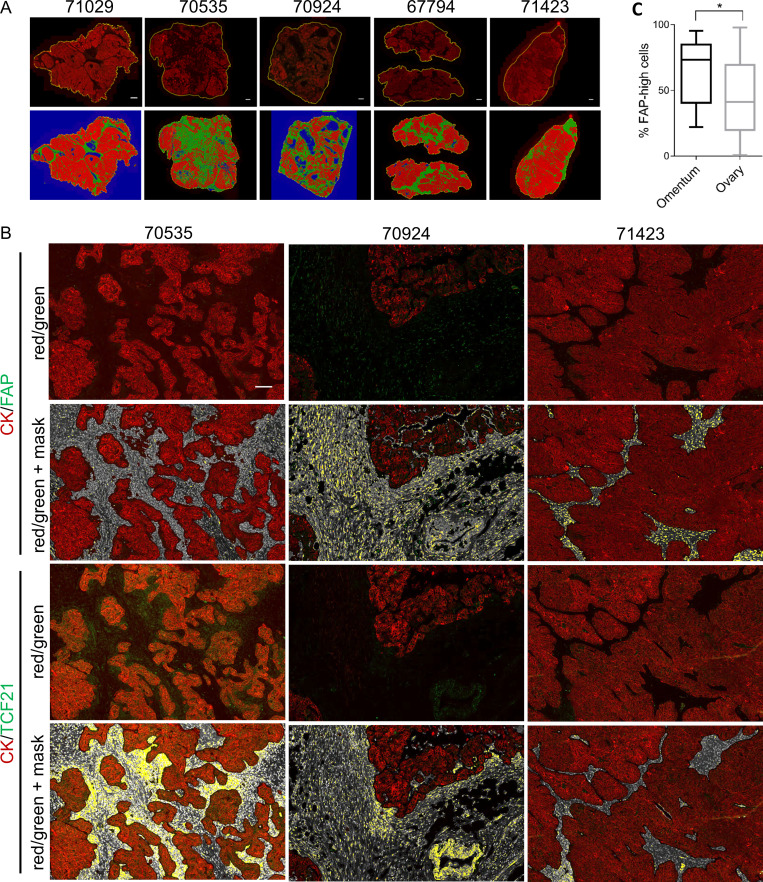
Figure S3.
Quantification of FAP and TCF21 in HGSOC specimens. (A) Low-power images of entire tissue sections showing the pan-CK staining in the red channel (top row) and the HALO software–generated classification of epithelial (red) and stromal (green) compartments. Blue regions are empty space. Scale bars = 1 mm. (B) Representative images of HGSOC specimens at higher magnification showing the epithelial pan-CK+ (red) and FAP+ or TCF21+ (green) staining and the corresponding mask generated by HALO software for quantification of the FAP or TCF21 signal within the stromal regions. Serial sections are shown for FAP versus TCF21 comparison. DAPI+ nuclei within the stroma are white, and FAP or TCF21+ signal in the green channel are overlayed with yellow. Scale bar = 500 µm. (C) Comparison of the %FAP-high cells in tumor tissue obtained from the primary site (ovary, n = 52) versus omental metastases (n = 10). *, P = 0.047, Student’s t test.

