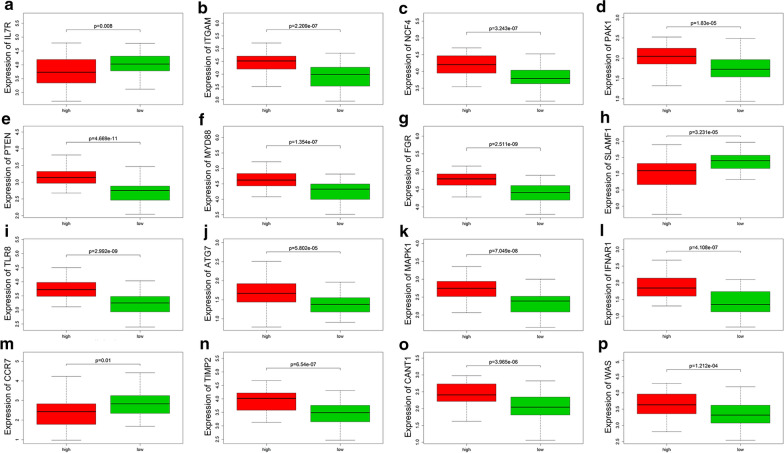
Fig. 5.
Correlation analysis of hub genes expression and the proportion of neutrophils. Red bar: samples with a high proportion of neutrophils; green bar: samples with a low proportion of neutrophils. Statistically significant was considered as the p-value < 0.05. a–p Correlation analysis of the proportion of neutrophils and expression of IL-7R, ITGAM, NCF4, PAK1, PTEN, MYD88, FGR, SLAMF1, TLR8, ATG7, MAPK1, IFNAR1, CCR7, TIMP2, CANT1 and WAS, respectively

