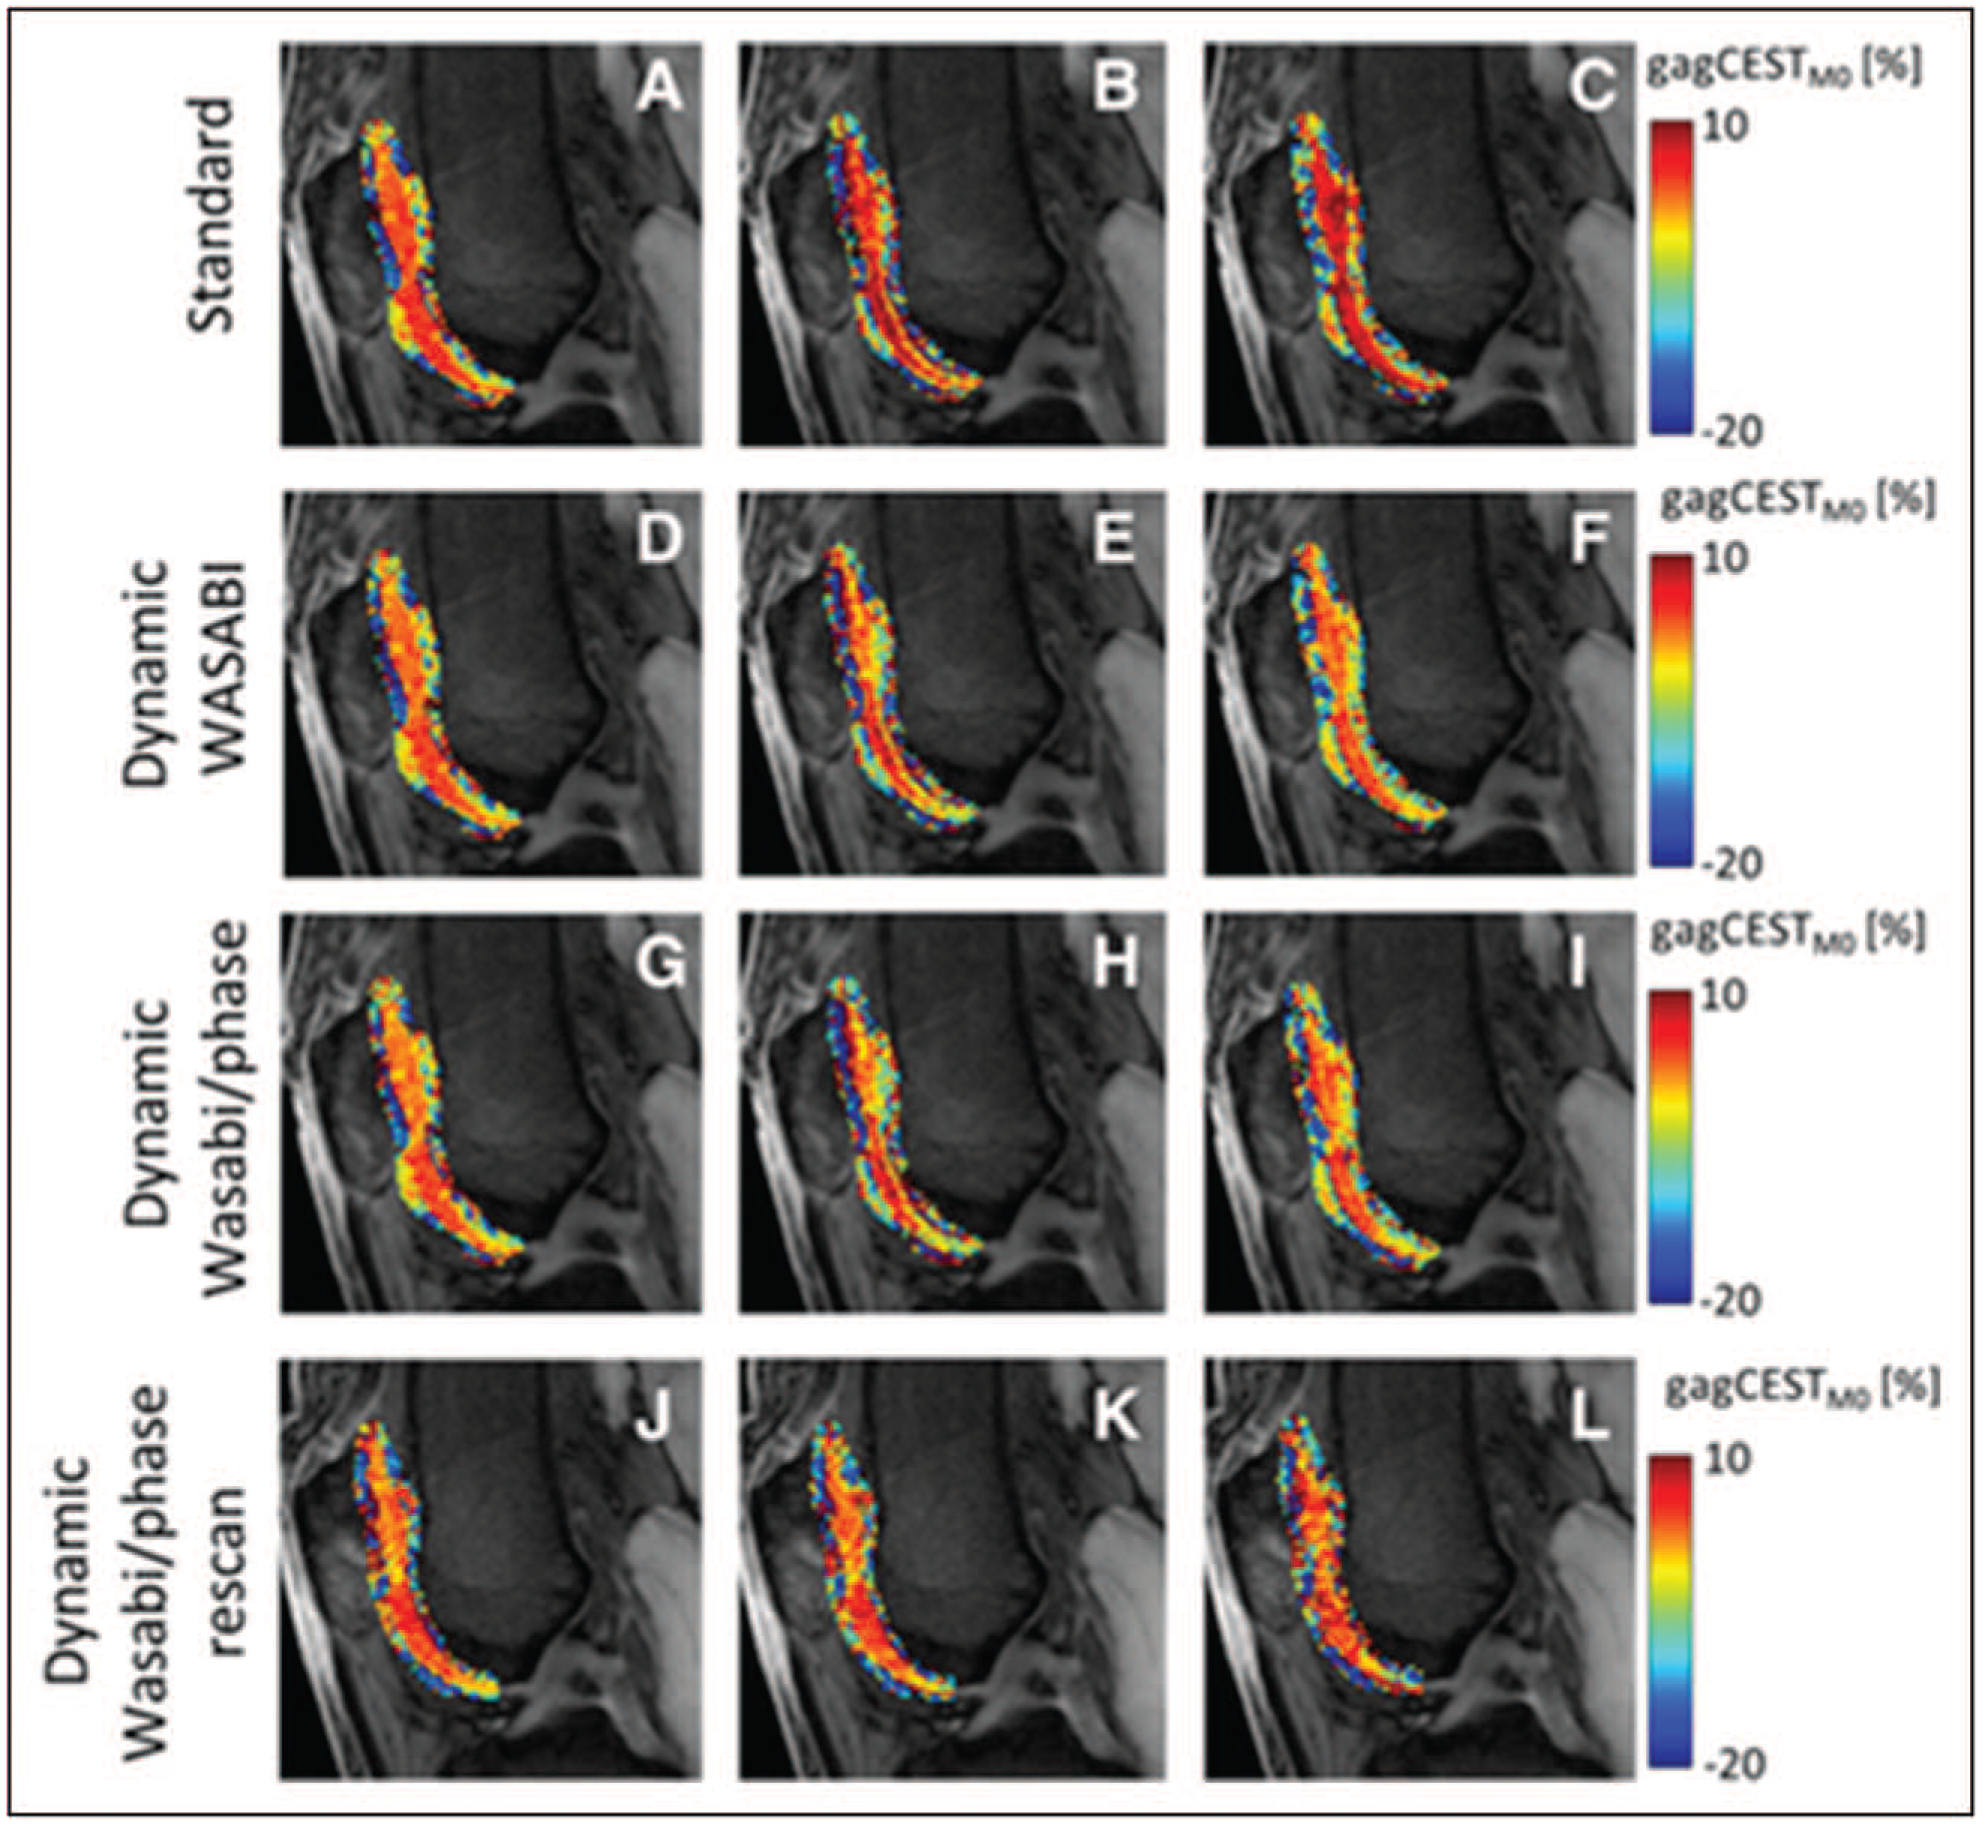
FIGURE 2.

Cropped M0 images superimposed with glycosaminoglycan chemical exchange saturation transferM0 contrast in patellar and femoral cartilage from identical measurements from a 32-year-old healthy volunteer, acquired at t = 5 min (a, d, g, j), t = 17 min (b, e, h, k), and t = 29 min (c, f, i, l). The glycosaminoglycan chemical exchange saturation transferM0 contrast of data using the standard B0 correction (a, b, c) shows an increase over time, whereas the dynamic WASABI (simultaneous mapping of water shift and B1) correction (d, e, f) and the dynamic WASABI/phase correction method (g, h, i) provide a stable contrast. The last row represents data from the same individual acquired 1 month later (j, k, l). Reproduced with permission [38].
