
FIGURE 3.
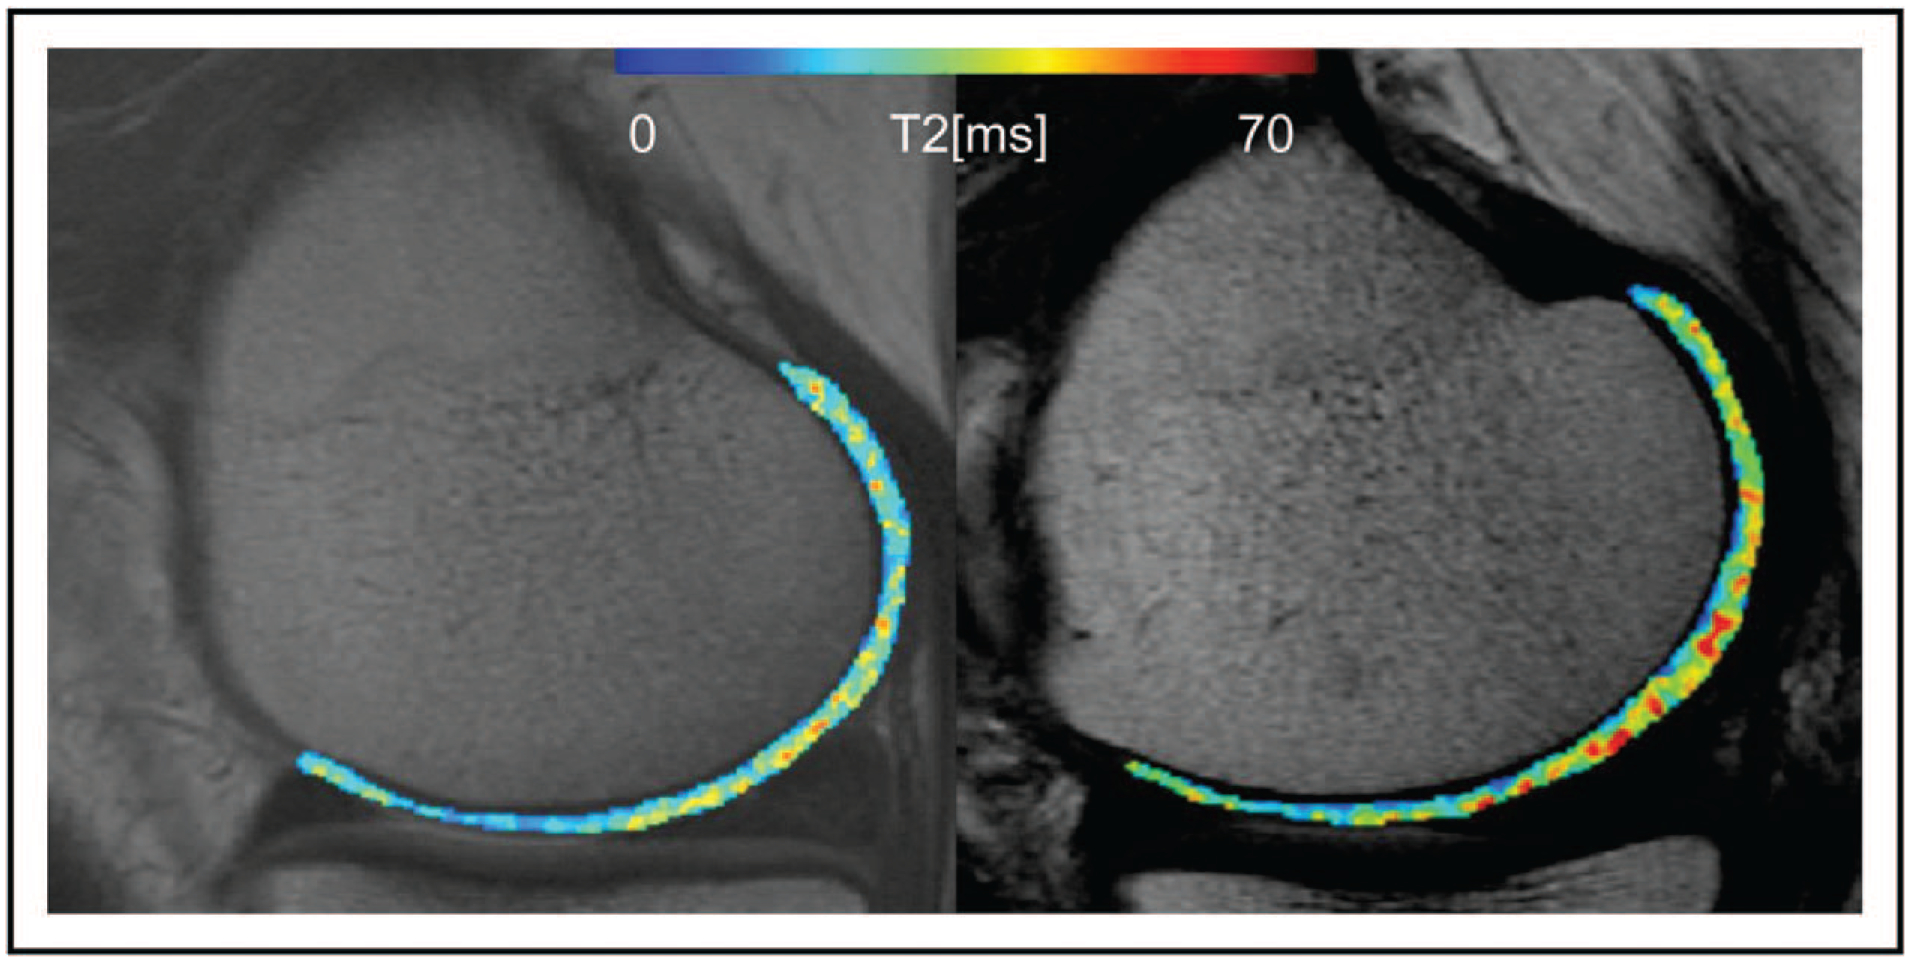
Representative T2 maps from an individual from the control cohort (left) and an individual from the incidence cohort (right). Cartilage T2 maps are median-filtered with a 3 × 3 kernel for visualization. Both individuals have no cartilage abnormalities and no pain; however, the individual from the incidence cohort has elevated mean T2 (39.12 versus 33.39 ms), elevated grey level co-occurrence matrix variance (311.63 versus 190.50), elevated grey-scale co-occurrence matrix contrast (466.16 versus 266.82), and elevated grey-scale co-occurrence matrix entropy (7.17 versus 6.80). Reproduced with permission [71].