Fig. 2.

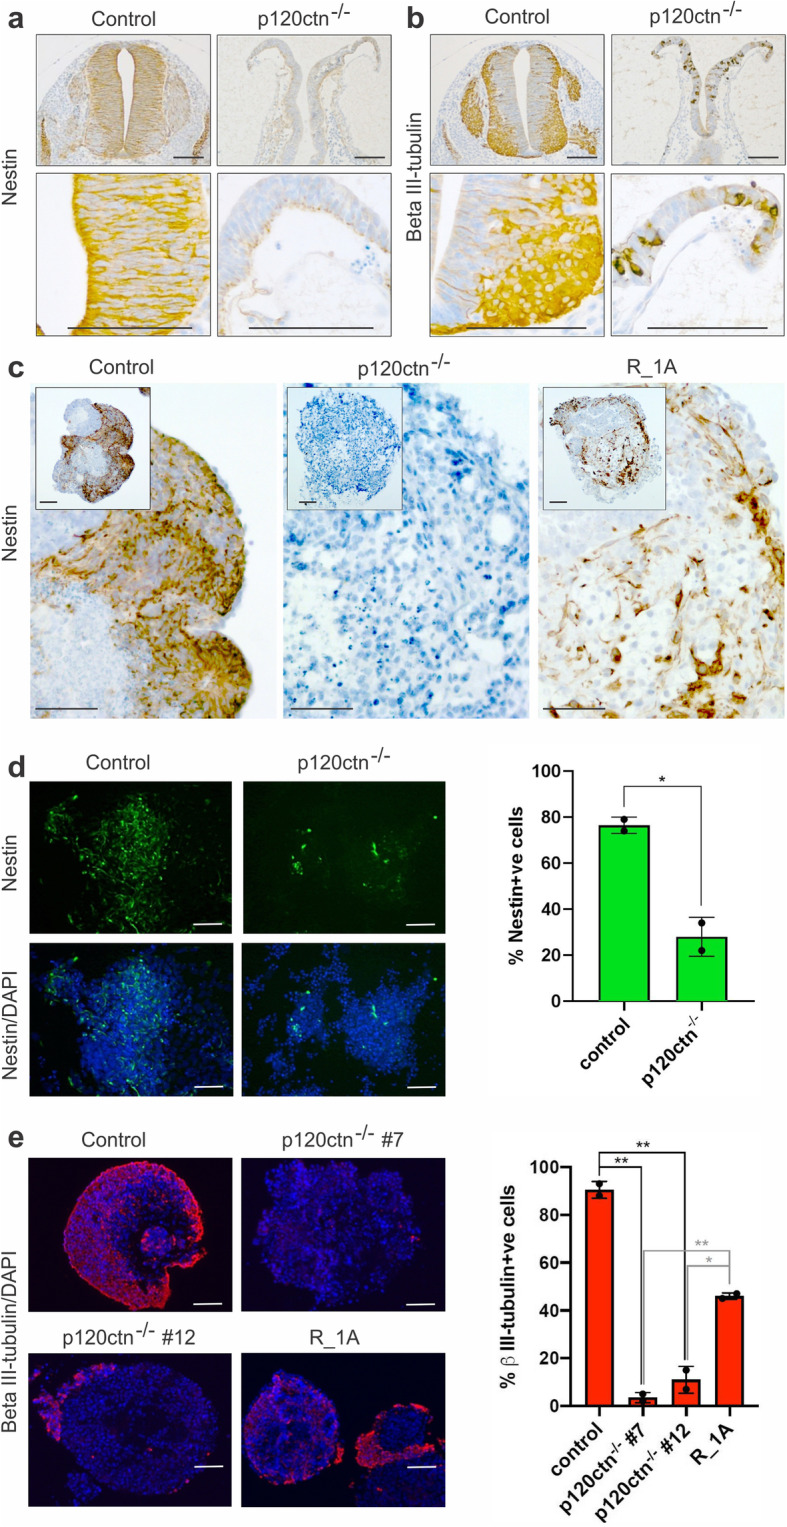
Reduced neurogenesis in p120ctn-null embryos and mESCs. a, b Immunohistochemical detection of Nestin (a, neuronal progenitor marker) and βIII-tubulin (b, neuronal marker) on paraffin sections from E9.5 control (p120ctnfl/fl littermates) and p120ctn-null embryos (three embryos per setup). Scale bars: 100 μm. c Immunohistochemical detection of Nestin in 30-day old EBs generated from control and p120ctn-null mESCs, and from an RMCE-targeted [29] mESC line expressing R26-driven wild-type p120ctn isoform 1A (designated R_1A). Scale bars: 100 μm. d Immunostaining of Nestin (left panel) in control and p120ctn-depleted mESCs, which were induced towards neurectoderm differentiation by culturing for 6 d in N2B27 medium. p120ctn loss abrogated mESC differentiation towards the neuronal fate. This neural induction experiment was performed twice. Scale bars: 25 μm. Graph (right panel) depicting the percentage of Nestin-positive cells in control and p120ctn-null cultures. The error bar represents the standard deviation of two technical replicates (coverslips). The P-value (* 0.0175) was calculated via an unpaired t-test. e Immunostaining of βIII-tubulin (left panel) in control and p120ctn-null mESCs that were converted into embryoid bodies for 4 d, then treated with retinoic acid for 4 d, and finally cultured for 8 d in N2B27 medium. We analysed a control mESC line, two independent p120ctn-null mESCs lines (#7 and #12) and rescued R_1A mESCs. Scale bars: 50 μm. Graph (right) depicting the percentage of βIII-tubulin-positive cells. The error bar represents the standard deviation of two independent quantifications in which at least 500 cells were scored per condition. The P-values (black: ** 0.0011; ** 0.0024; grey: ** 0.0018; * 0.0136) were calculated via an unpaired t-test
