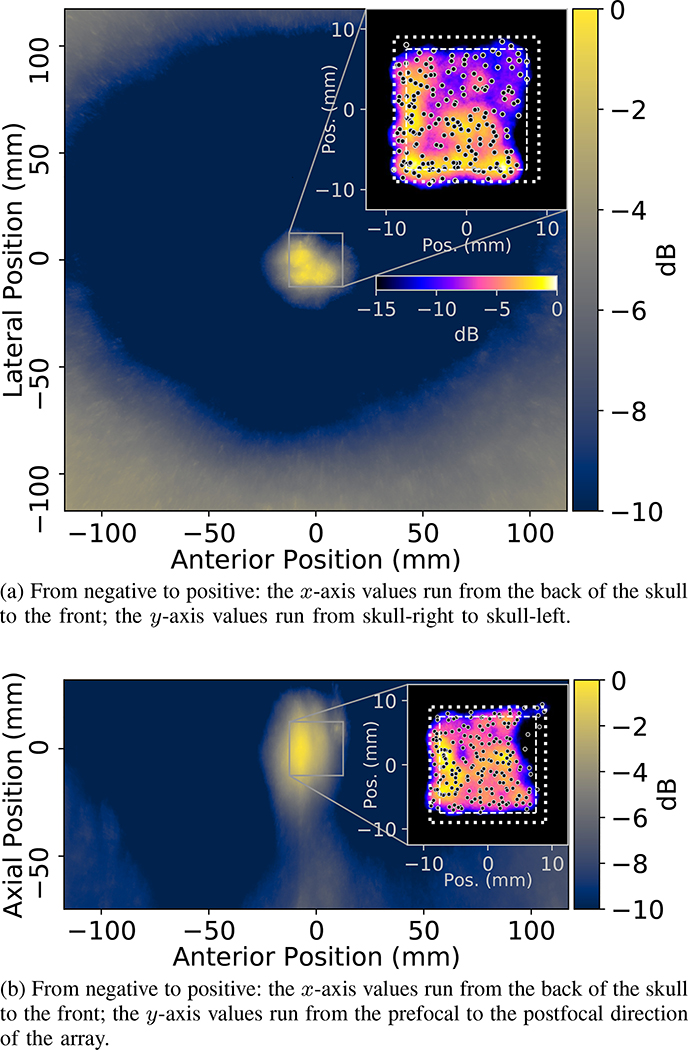
Fig. 7.
ACE feedback generated maps of the cavitation activity associated with the treatment delivered to generate lesion shown in Figure 6. The maps show the mean values of the signal amplitude fields (calculated using Eq. 3, and averaged over all pulses) within ±1.67mm of the planes of the shown maps, where the maps are centered about the geometric origin of the array. The skullcap is evident in the maps as the bright regions near the plot boundaries. The inset plots show heatmaps of the countable number of detected cavitation events (i.e. the applied dose) within the ±1.67mm bounds of the planes of the shown maps, under the assumption each event had a radius of 1.5mm; the heatmaps were normalized with respect to the maximum number of detected events within the mapped regions and brighter regions in the inset plots correspond to greater numbers of detected events at those locations. Note: the color-map/scaling of the inset plots is not equivalent to that of the underlying treatment maps, in the interest of space the colorbar corresponding to the inset plots is only shown in Fig. 7a. The black dots in the inset plots show the mean localization results of all cavitation events generated at each unique steering location within the mapped region. The square outlines in the inset plots show the boundary of the cubic region through which treatment was steered (interior, dashed lines) plus a 1.5mm margin (exterior, dotted lines) to account for the sizes of the bubbles. The map shown in Fig. 7b is approximately coaligned with the slice plane of the ablated volume in Fig. 6.

