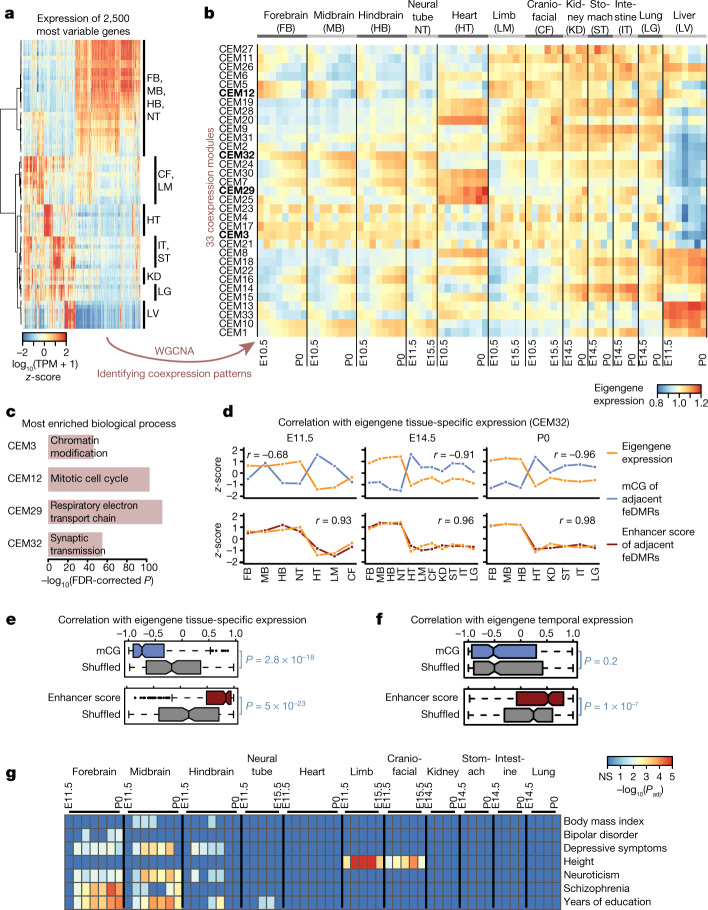
Fig. 5. Association between mCG, gene expression and disease-associated SNPs.
a, Expression profiles for 2,500 of the most variable genes. b, Thirty-three CEMs identified by WGCNA and their eigengene expression. CEMs shown in bold are related to c. c, The most enriched biological process terms of genes in four representative CEMs using EnrichR49. P values based on one-tailed Fisher’s exact test with sample sizes 6,766, 602, 126 and 2,968 for CEM3, CEM12, CEM29 and CEM32, respectively, adjusted for multiple testing correction using the Benjamini–Hochberg method. d, Correlation of the tissue-specific eigengene expression (orange) for each developmental stage with the mCG level or enhancer score (blue or red, respectively) z-scores of feDMRs linked to the genes in CEM32. Pearson correlation coefficients were calculated (n = 7, 11 and 8 for E11.5, E14.5 and P0, respectively). e, f, Pearson correlation coefficients of mCG level or enhancer score (blue or red, respectively) of feDMRs linked to the genes in each CEM with tissue-specific eigengene expression across all 33 CEMs on all stages (e), and temporal epigengene expression across all CEMs in all tissue types (f), excluding liver. P values based on two-tailed Mann–Whitney test (n = 231 (e), n = 363 (f)). Middle line, median; box, upper and lower quartiles; whiskers, 1.5 × (Q3 − Q1) above Q3 and below Q1; points, outliers. g, feDMRs are enriched for human GWAS SNPs associated with tissue- or organ-specific functions and tissue-related disease states. P values calculated using LD score regression47, adjusted for multiple testing correction using the Benjamini–Hochberg approach.

