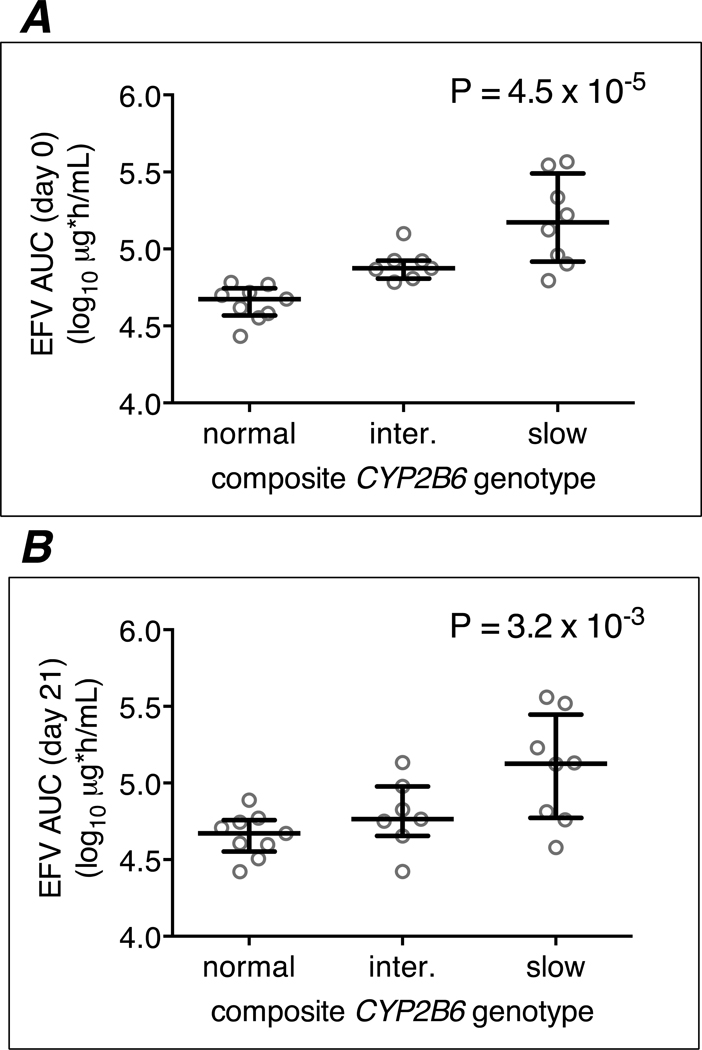
Figure 1. Relationships between CYP2B6/CYP2A6 genotype levels and plasma efavirenz log10 AUC0–8h values among 24 efavirenz group participants.
Panel A: associations at day 0 with CYP2B6/CYP2A6 genotype stratified into 3 levels; Panel B: associations at day 21 with CYP2B6/CYP2A6 genotype stratified into 3 levels. Error bars indicate median and interquartile range. Linear regression model P-values are shown. EFV = efavirenz; AUC = area under the concentration-time curve.

