
FIG. 4.
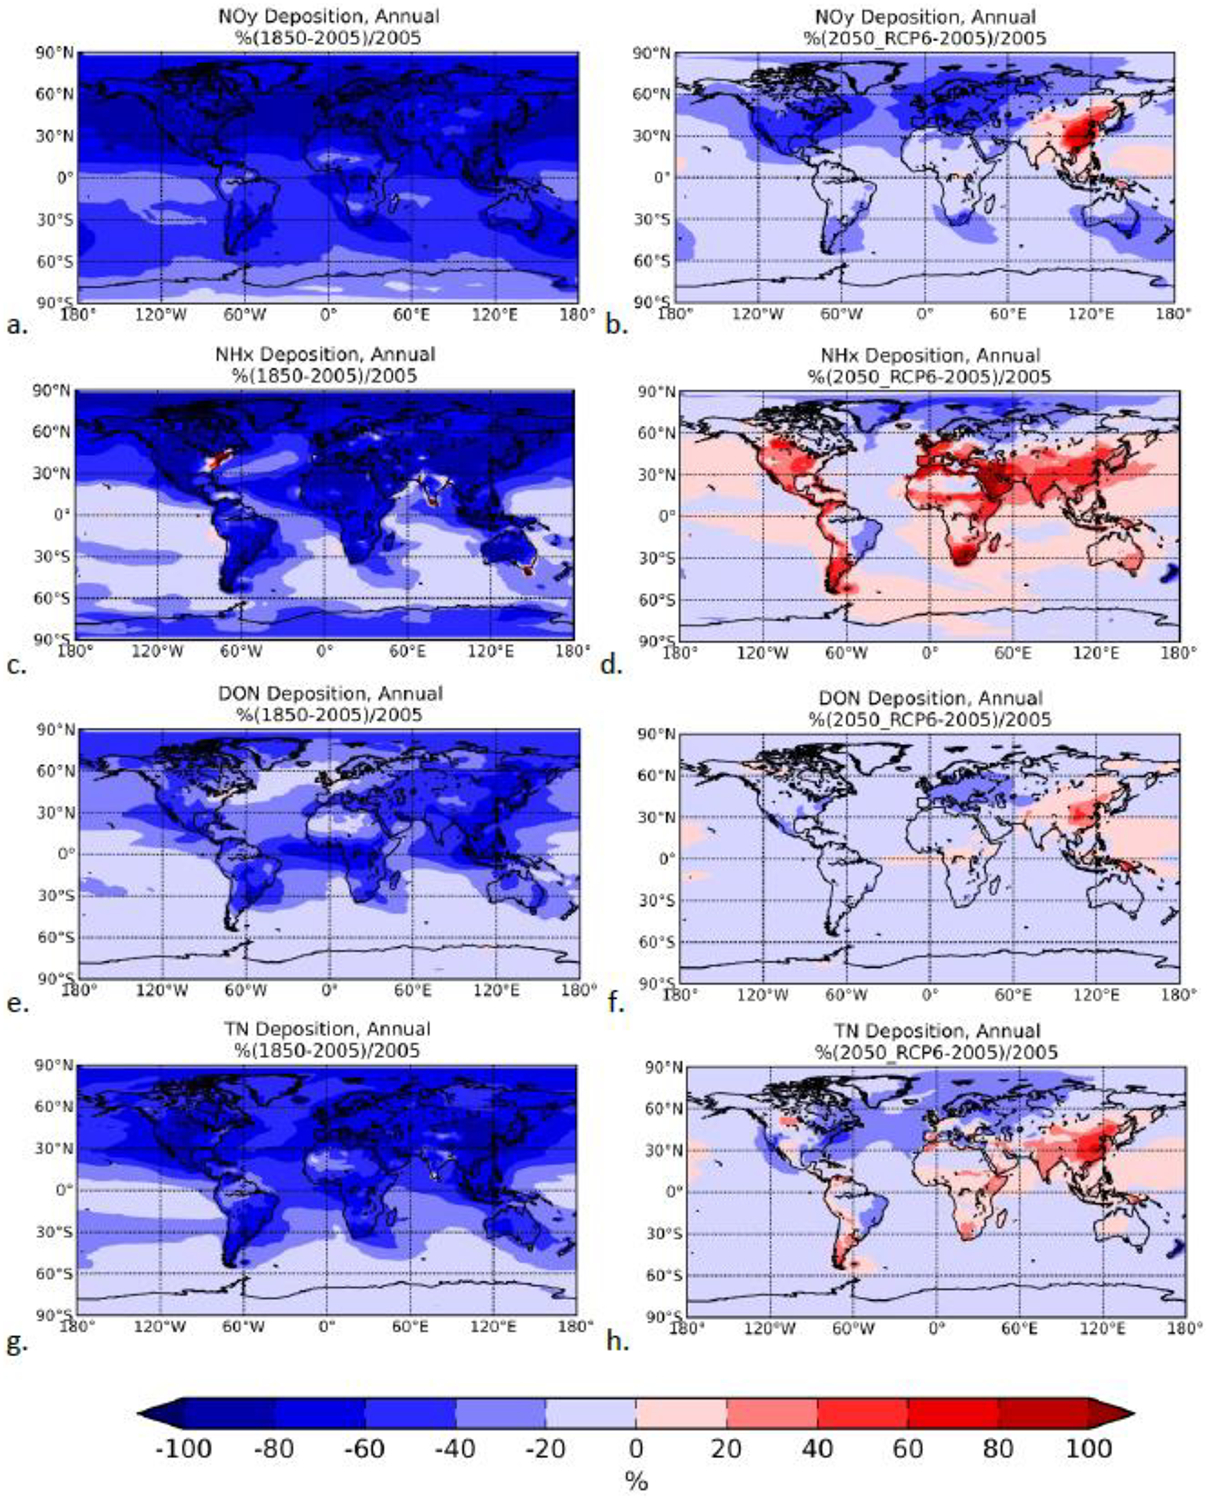
Percent changes relative to 2005 annual deposition flux computed by TM4-ECPL for NOy, NHx, DON and TN due to pre-industrial emissions (left panels) and due to anthropogenic RCP6.0 emissions (right panels).
Official websites use .gov
A
.gov website belongs to an official
government organization in the United States.
Secure .gov websites use HTTPS
A lock (
) or https:// means you've safely
connected to the .gov website. Share sensitive
information only on official, secure websites.
Percent changes relative to 2005 annual deposition flux computed by TM4-ECPL for NOy, NHx, DON and TN due to pre-industrial emissions (left panels) and due to anthropogenic RCP6.0 emissions (right panels).