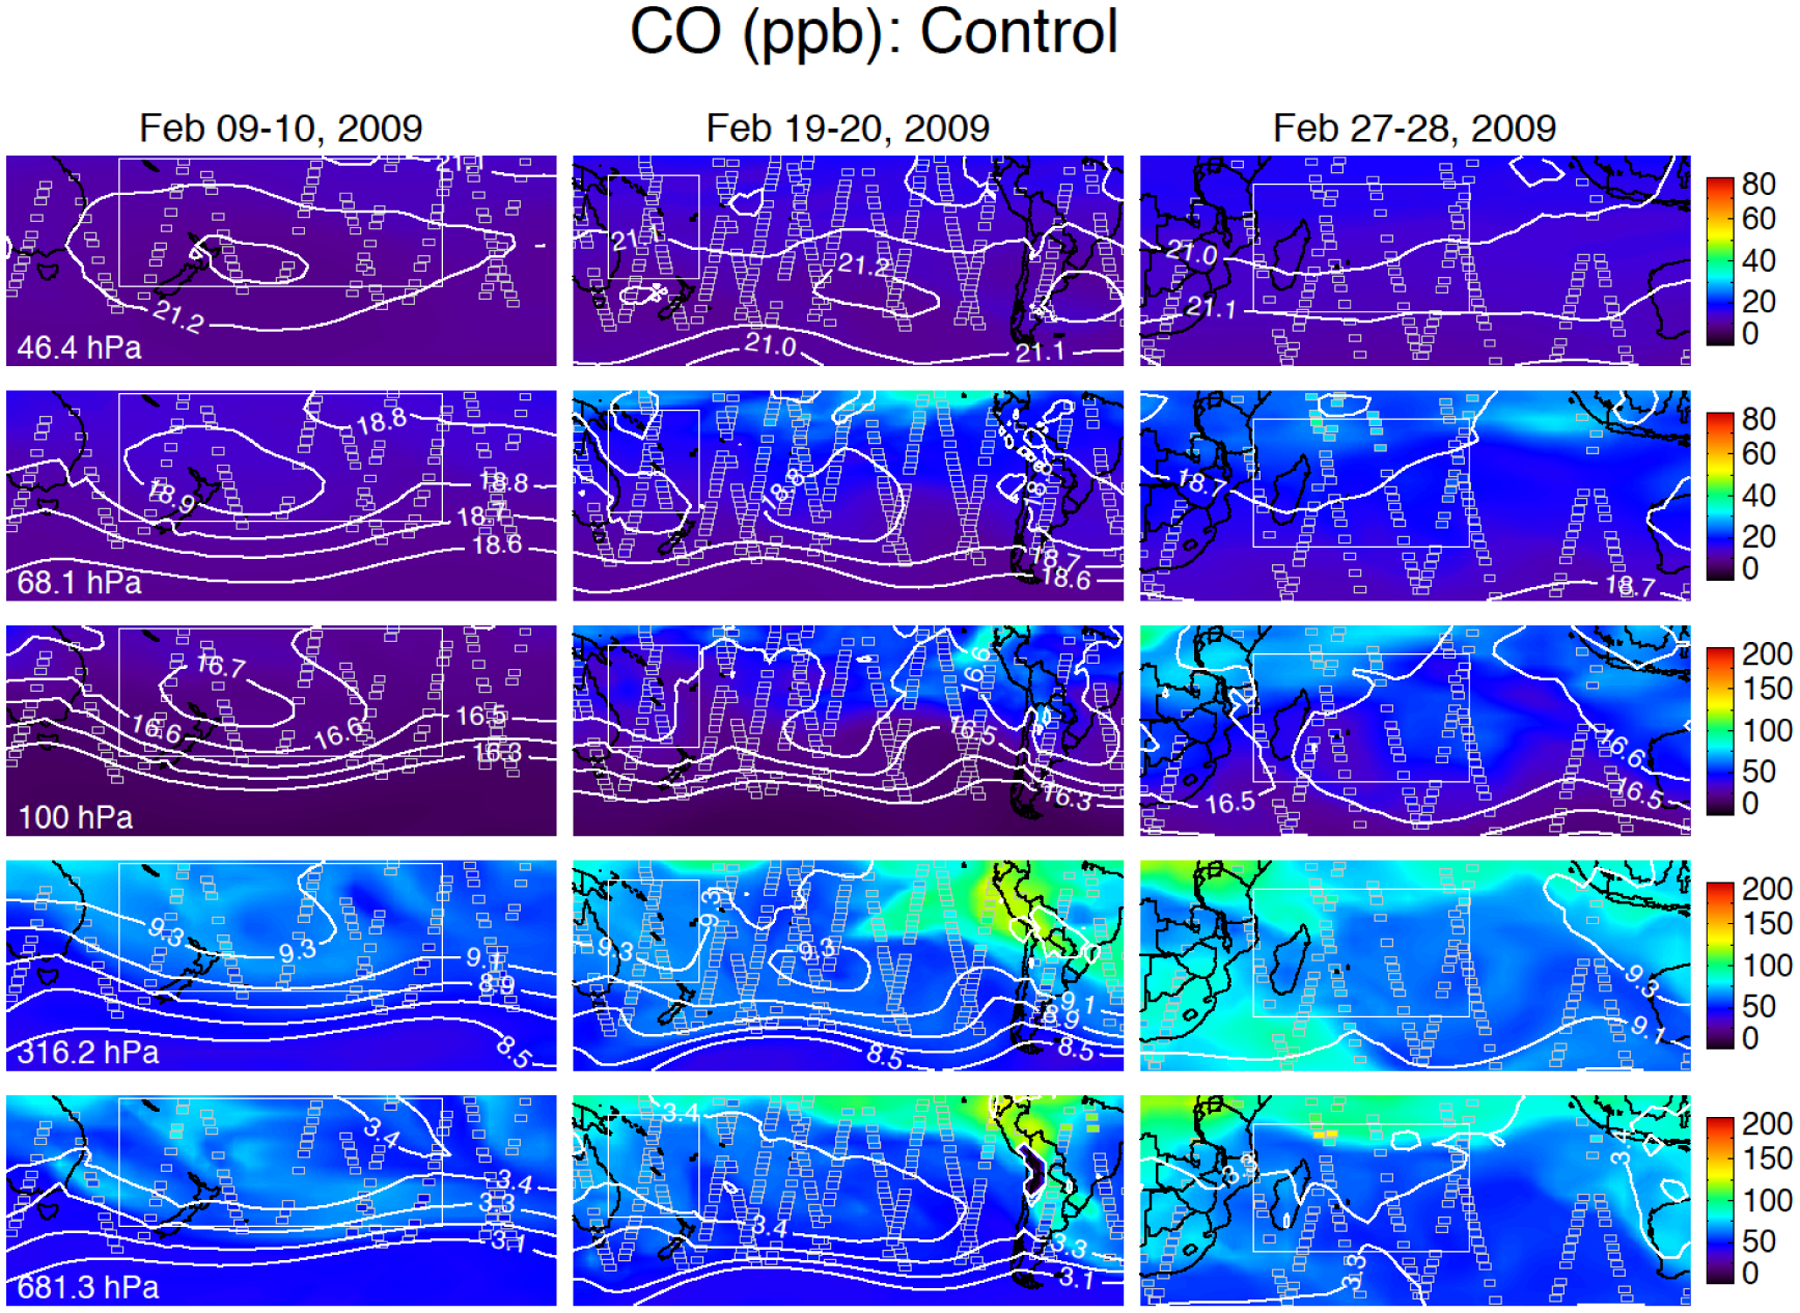
Figure 3.

ModelE2 control run (CTRL) with no fire. Colored shading shows raw ModelE2 CO (ppb) (note changes in CO scale with height). Small boxes show the ModelE2 CO (ppb) sampled along the Aura orbit and with averaging kernel smoothing. White contours show geopotential height in km. Large white boxes show boxes over which CO profiles are averaged.
