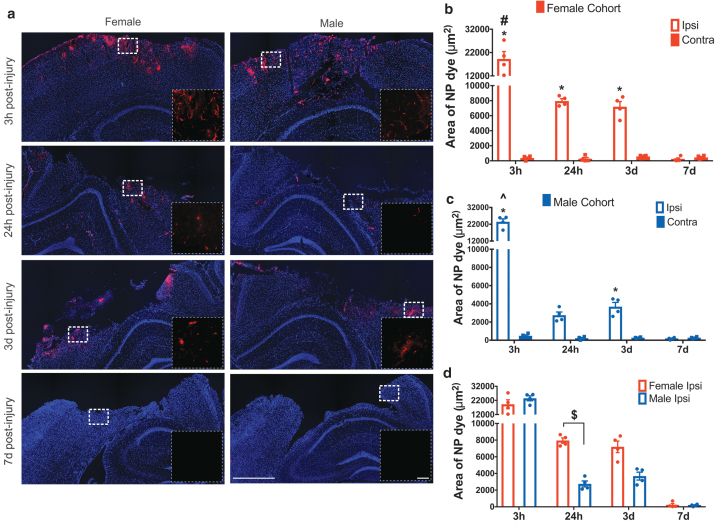
FIG. 2.
(a) NP accumulation after TBI in the ipsilateral hemisphere: Representative images of NP extravasation at 3 h, 24 h, 3 days, and 7 days post-CCI. The first column shows the NP accumulation in the female cohort and the second column in males. The inset image is the enlarged view of the white dotted box in the main image. Main image scale bar = 750 μm, inset image scale bar = 100 μm. (b, c) NP accumulation in female and male cohort: Accumulation of NP in the female cohort (b) and male cohort (c) at different time points postinjury. *p < 0.05 compared to their respective contralateral hemisphere and 7-day ipsilateral, two-way ANOVA, Bonferroni's multiple comparisons. #p < 0.05 compared to 24-h and 3-day ipsilateral hemisphere. ^p < 0.05 compared to 24-h ipsilateral hemisphere, $p < 0.05 compared to male 24-h ipsilateral hemisphere, two-way ANOVA, Bonferroni's multiple comparisons. Error bars represent standard error of mean, n = 4. (d) Quantification of NP accumulation in ipsilateral hemisphere of female and male cohorts across different time points. NP, nanoparticle; TBI, traumatic brain injury. Color images are available online.

