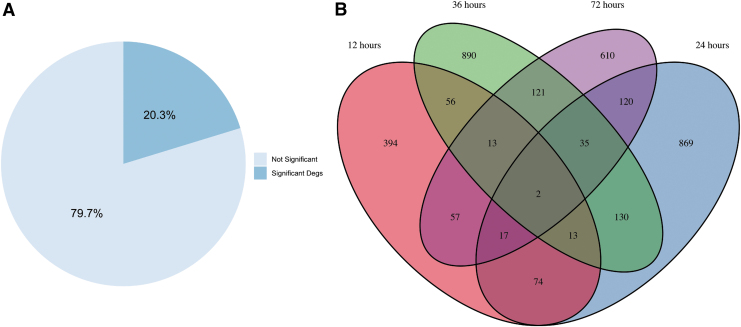
FIG. 3.
(A) Diagram showing the overall percentage of significant (p ≤ 0.05) and nonsignificant DEGs between hMSC treated urethra and untreated urethra considering all the DEGs at all the time points (12, 24, 36, and 72 h). (B) Venn diagram of the significant DEGs in hMSC treated injured urethra compared with untreated injured urethra over time with the number of overlapped DEGs between time points noted. DEG, differentially expressed gene.

