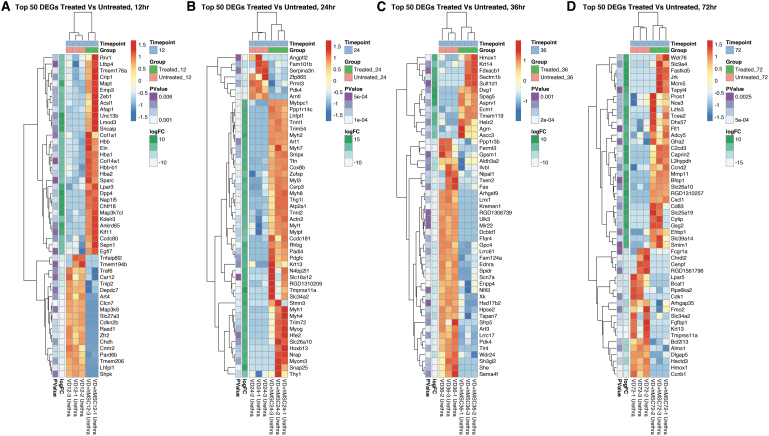
FIG. 4.
Hierarchically clustered heat maps showing DEGs in hMSC treated versus untreated urethra. This figure illustrates the top 50 DEGs in hMSC treated versus untreated urethra at (A) 12 h, (B) 24 h, (C) 36 h, and (D) 72 h ranked by nominal p value (leftmost column, all p ≤ 0.05) and FC (second column from the left). All rows are normalized (z-score) so that red coloring is upregulated versus the other group and blue is downregulated.

