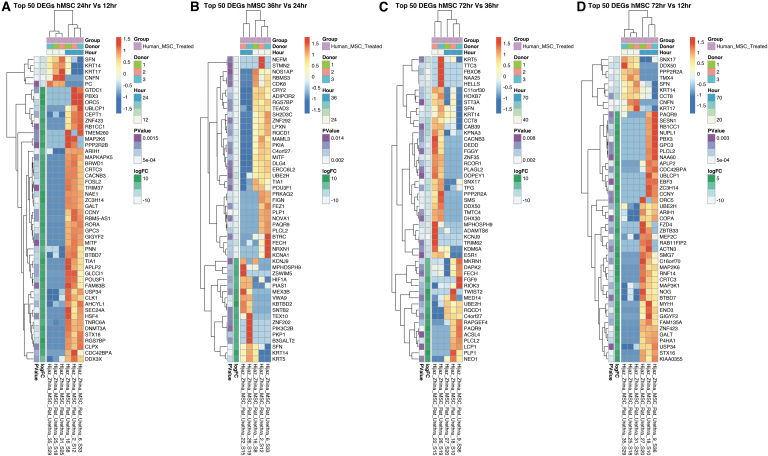
FIG. 6.
The top 50 DEGs between gene expression in laser-captured hMSCs from injured urethra in pairs of consecutive time points ([A] 12 vs. 24 h, [B] 24 vs. 36 h, [C] 36 vs. 72 h, and [D] 12 vs. 72 h) postinjury. Comparison shows a persistently altered gene expression signature. Ranked by nominal p value (leftmost column, all p ≤ 0.05). All rows are normalized (z-score) so that red coloring is upregulated versus the other group and blue is downregulated.

