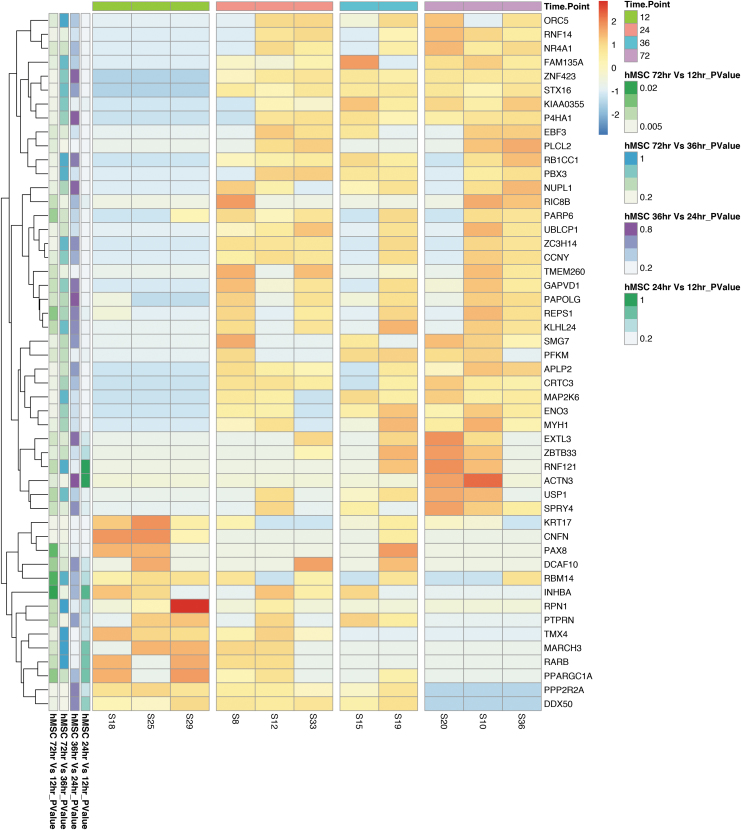
FIG. 7.
Top 50 DEGs by magnitude between laser-captured hMSCs from injured urethral tissue within which expression changes greatly over the time course of 72 h filtered by nominal p value (leftmost column, all p ≤ 0.05) and ranked by FC (second column from the left). All rows are normalized (z-score) so that red coloring is upregulated versus the other group and blue is downregulated.

