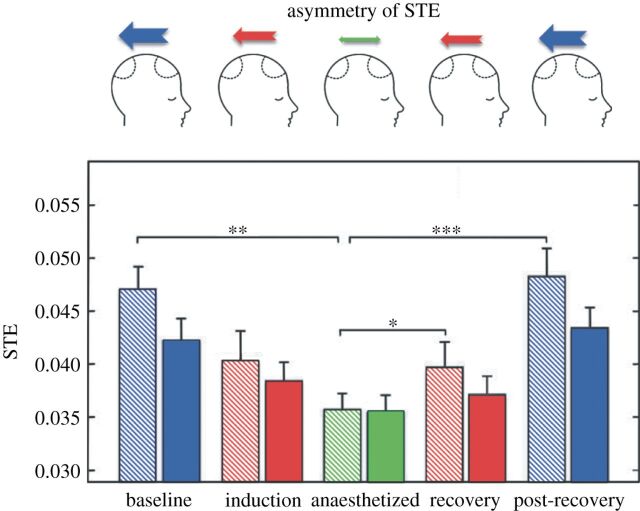
Figure 3.
Inhibition and recovery of frontal–parietal STE. The schematic diagrams in the top row represent the changing asymmetry between feedback and feed-forward STE over the five states. The feedback STE from frontal to parietal electrodes is preferentially inhibited and recovers across states. The feedback and feedforward STE are denoted with striped and solid bars, respectively, for each state. Error bar denotes the standard error (*p<0.005, **p<0.01, ***p<0.001, n=18 patients). (Courtesy of Ku et al. [30].)

