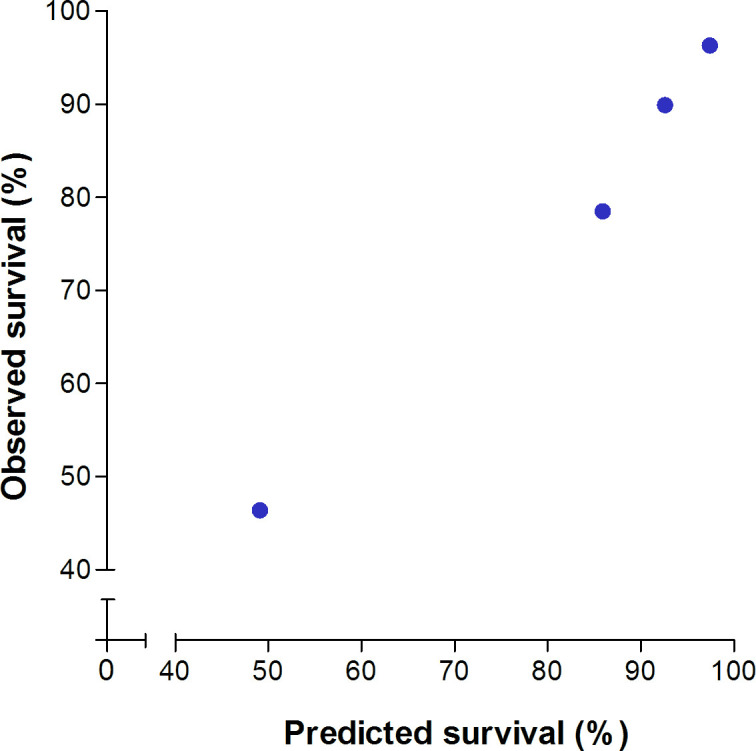
Figure 2.

Observed versus predicted LT-free survival according to categorised risk groups. The dots represent four subgroups of patients in our cohort based on GLOBE score range with the corresponding mean predicted LT-free survival (x-axis) and observed LT-free survival (y-axis). From left to right: (1) a GLOBE score of >0.91, corresponding to a 5-year risk of >20%; (2) a GLOBE score of 0.51–0.91, corresponding to a 5-year risk of 10%–20%; (3) a GLOBE score of −0.21 to 0.51, corresponding to a 5-year risk of 5%–10%; and (4) a GLOBE score ≤−0.21, corresponding to a 5-year risk of ≤5%. LT, liver transplantation.
