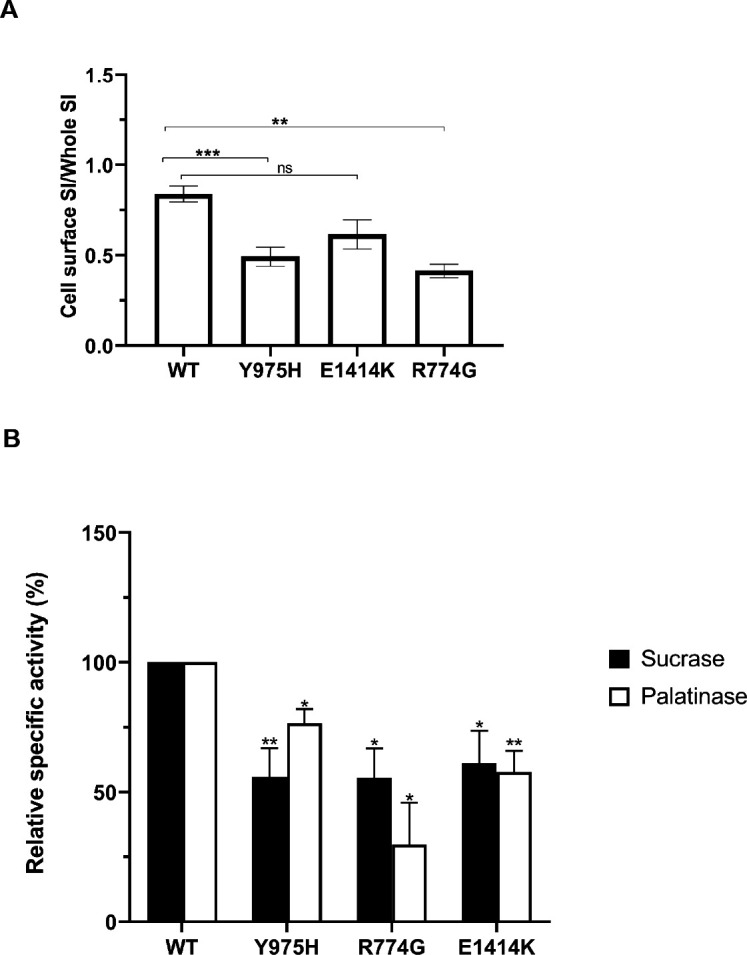
Figure 2.

(A) Trafficking of SI proteins to the cell surface. SI-WT or SI mutants expressed in COS-1 cells were biotinylated and immunoprecipitated. Biotinylated cell surface SI was quantified versus total cellular SI. SI mutants at the cell surface were quantified versus SI-WT set to 100%. (B) Relative Specific enzyme activities of SI-WT and SI mutants. SI proteins were immunoprecipitated from transfected COS-1 cells and assayed for enzymatic activity versus sucrose or palatinose. Western blotting of similar samples was used to quantify the specific activities compared with SI-WT that was set to 100% for sucrase or palatinase. *p<0.05,**p<0.005 and ***p<0.0005.
