Figure 7.
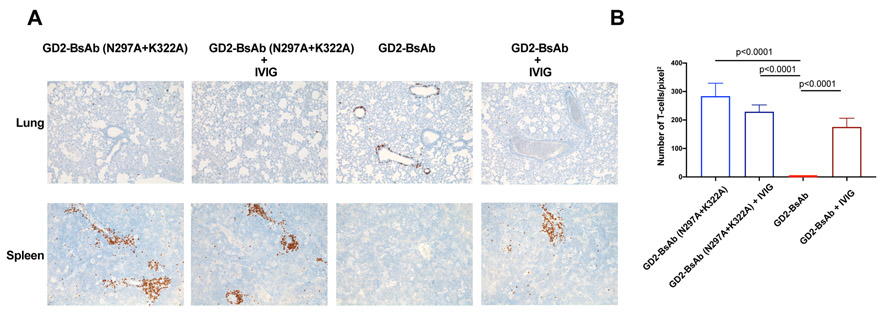
Effect of IVIG on T-cell trafficking. A, Representative IHC images of huCD45+ T cells in lungs and spleens of mice treated with and without IVIG (100× magnifications). B, Enumeration of T cells per pixel2 (area) of IHC images of huCD45+ T cells in mouse spleens. Cells were counted from two randomly selected fields for each mouse (n = 10). The results shown are representative results from at least three independent repeats. Statistical significance of all results was determined by t test. If it is not labeled, it is not significant.

