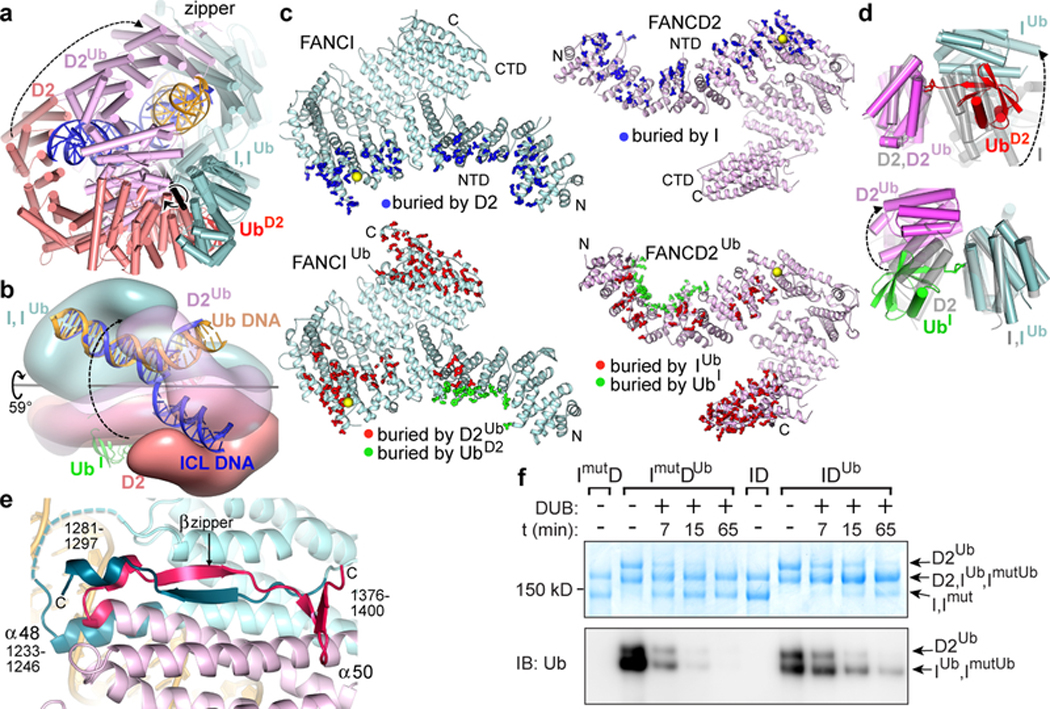
Figure 3 |. Conformational changes on ubiquitination.
a, Non-ubiquitinated ID (cyan, salmon and blue for FANCI, FANCD2 and DNA, respectively) superimposed on IDUb (cyan, magenta and yellow for FANCIUb, FANCD2Ub, and DNA, respectively) by aligning FANCI. UbD2 is red (UbI obscured in this view). The rotation axis is shown as a thick black stick with the rotation indicated by a circular arrow. FANCD2 movement is indicated by a dashed arrow linking equivalent structural elements. The CTD-CTD interaction region is labeled “zipper”. Orientation similar to Fig. 2a. b, View looking approximately down the vertical axis of a with the two complexes rendered as semi-transparent surfaces to reveal the DNA inside. c, FANCI (left top, cyan), FANCIUb (left bottom, cyan), FANCD2 (right top, pink), and FANCD2Ub (right bottom, pink) proteins showing residues (thick sticks) with a reduction in solvent accessibility due to interactions between FANCI and FANCD2 (top pair, blue sticks), between FANCIUb and FANCD2Ub (bottom pair, red sticks), and between each protein and the ubiquitin of the other paralog (bottom pair, green sticks). Yellow spheres mark ubiquitination sites. d, Close-up view of the ID and IDUb complexes superimposed on the FANCD2 ubiquitination site (top) or on the FANCI ubiquitination site (bottom). Non-ubiquitinated ID is transparent gray. e, The IDUb CTD zipper looking down the vertical axis of b. Residues unstructured in non-ubiquitinated ID are shown in darker shades and are labeled. Dashed cyan line is a loop unstructured in both complexes. f, SDS-PAGE gel of the de-ubiquitination of wild type IDUb and mutant ImutDUb complexes, both at 940 nM, by USP1-UAF1 (400 nM) at the indicated time points, detected by Coomassie staining (top) or anti-ubiquitin immunoblot (bottom). The positions of the substrates and products are marked. Repeated n=3 times.

