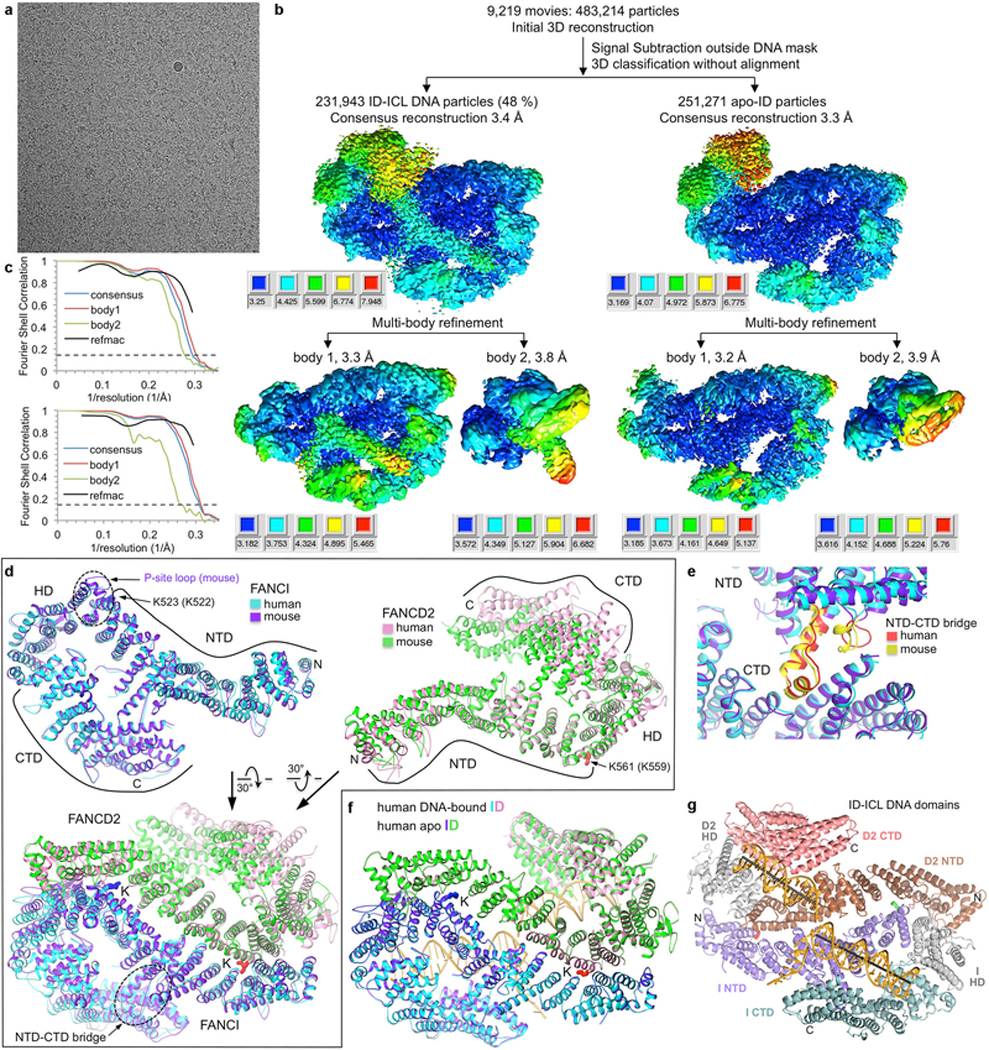
Extended Data Figure 1 |. Cryo-EM reconstructions of the non-ubiquitinated ID-ICL DNA and apoID complexes.

a, Micrograph of non-ubiquitinated ID-ICL DNA particles. The presence of excess DNA at 0.8 mg/ml obscures the protein particles. The particles were collected in five data sets. b, Flow chart of single particle cryo-EM data processing for the ID-ICL DNA and apo-ID complexes. Consensus (top) and focused maps from the RELION3 multi-body refinement, temperature-factor sharpened and masked, are colored by local resolution estimated with the RELION3 postprocess program. The resolution range is mapped to the colors in the inset next to each map. Orientation is similar to Figure 1a. The particle has dimensions of 164 Å, 116 Å, 96 Å. Additional details are in Methods. c, Top graph shows gold-standard FSC plots between two independently refined half-maps for the ID-ICL DNA consensus reconstruction (blue curve), for the RELION3 multi-body refinement of the larger body1 consisting of FANCI, FANCI-bound dsDNA and ssDNA, and FANCD2 residues 43–623 (red curve), and for the smaller body2 consisting of FANCD2 residues 624–1376 and the FANCD2-associated dsDNA (green curve). The FSC curve for the final model versus the composite map combining the cryo-EM maps of the two bodies is shown in black. Dashed line marks the FSC cutoff of 0.143. Bottom graph shows the gold-standard FSC plots between two independently refined half-maps for the consensus reconstruction of the apo-ID complex (blue curve), of the RELION3 multi-body refinement of the two bodies, and of the model refined with REFMAC5 (black). d, Top left panel shows the superposition of the human FANCI structure on mouse FANCI from the crystal structure of the mouse ID complex32 with an r.m.s.d. of 1.8 Å for 926 out of 1,168 common Cα atoms (colored blue and purple for human and mouse, respectively). The majority of the residues that do not superimpose are in the N-terminal 183 amino-acid segment that packs with the FANCD2 HD domain that is mobile in the cryo-EM structure. Other differences include FANCI residues 551–574 that are disordered in human FANCI, while the corresponding mouse FANCI segment (marked by dotted oval and labeled P-site loop) is well ordered at the FANCI-FANCD2 interface, and affects the conformations of flanking helical repeats. The FANCD2 region with which this segment packs in the mouse ID complex is shifted by ~5 Å away from FANCI in the human ID complex. This segment also contains the phosphorylation sites of ATR kinase32,33. Ubiquitination sites, N- and C- termini and individual domains are marked. Top right panel shows the superposition of the human FANCD2 on the mouse structure with an r.m.s.d. of 2.0 Å for 501 out of 1,131 common Cα atoms (colored pink and green for human and mouse, respectively). The low level of overall structural overlap is due to the flexibility of the FANCD2 CTD and HD domains in the cryo-EM structure compared to the mouse ID crystal structure, where the FANCD2 CTD is involved in crystal packing contacts that limit its mobility. Another difference involves the first ~200 residues that cap the FANCD2 NTD solenoid. This segment is displaced by 5 Å in the mouse structure owing to the ordering of the aforementioned FANCI phosphorylation-site loop at the interface. Bottom panel shows the superposition of human ID on the crystal structure of mouse ID with an r.m.s.d. of 2.2 Å for 1,302 out of 2,312 common Cα atoms. The superimposed segments are primarily the FANCI and FANCD2 NTD solenoids, including their ubiquitination sites but excluding their N-termini as discussed above, and most of the FANCI CTD domain. The dashed oval marks the helical protrusion (NTD-CTD bridge) from the FANCI NTD that packs with its CTD and rigidifies the structure. The lack of an NTD-CTD bridge in FANCD2 is associated with the increased mobility of its CTD relative to the NTD. e, Close-up view of the FANCI NTD-CTD bridge of the human and mouse structures colored red and yellow, respectively. f, DNA binding does not cause any substantial conformational differences, except for the FANCD2 CTD that exhibits increased mobility in apo-ID. The human ID-ICL complex (cyan FANCI and pink FANCD2) can be superimposed on the human apo-ID complex (purple FANCI and green FANCD2) in its entirety with a Cα r.m.s.d. of 0.9 Å (2,291 common Cα atoms). g, The human ID-ICL DNA complex colored according to the individual proteins’ domains as indicated, in the same orientation as Figure 1a.
