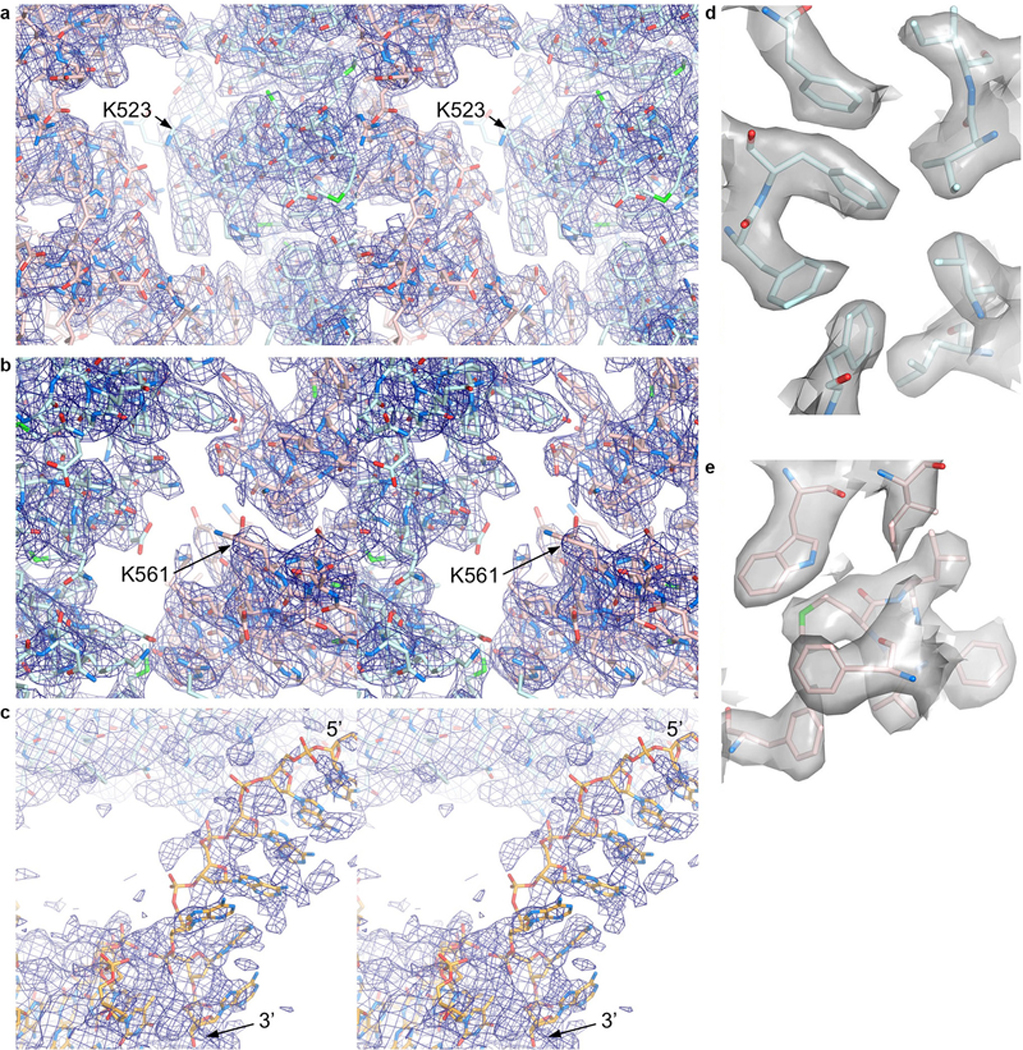
Extended Data Figure 3 |. Cryo-EM density from post-processed maps of non-ubiquitinated ID bound to ICL DNA.

a-b, Stereo view of the 3.3 Å cryo-EM density from the post-processed reconstruction using multi-body refinement. Map shows the vicinity of a, the FANCI ubiquitination site (Lys523 marked) with portions of FANCI residues 475–593 (cyan) and FANCD2 residues 174–287 (pink) shown in stick representation, and b, the FANCD2 ubiquitination site (Lys561 marked), with portions of FANCD2 residues 482–578 and of FANCI residues 123–223. O and N atoms are colored half-bonded red and blue, respectively, for both proteins. c, Stereo view of the map from a focusing on the ssDNA (5’ and 3’ ends marked) at the FANCI CTD, as well as a portion of the FANCI-bound dsDNA. The DNA is in stick representation colored half-bonded yellow, red and blue for C, O, N atoms, respectively. The map is shown at a low contour level because the ssDNA has high temperature factors, and its density is broken up due to the temperature-factor applied in post-processing being calculated from the entire map. ssDNA density before post-processing can be seen in the panel of maps in Extended Data Fig. 2, d and e. d-e, Mono view of the 3.3 Å cryo-EM density depicted as a semi-transparent surface at the hydrophobic core of d, the FANCINTD, showing the residues 202, 214, 217, 236–237, 271–272, and 300, and e, of the FANCD2NTD, showing the residues 347, 364, 368, 380, and 383–386.
