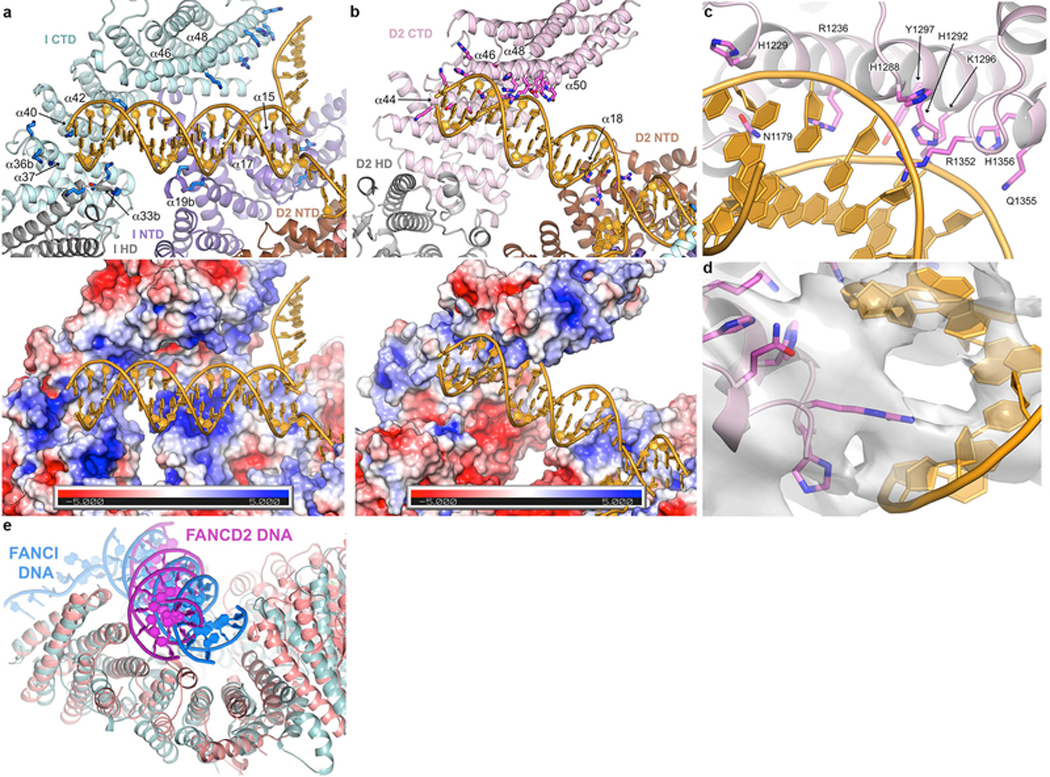
Extended Data Figure 4 |. DNA binding by the non-ubiquitinated ID complex.

a, DNA binds to an extended basic surface of FANCI. Cartoon representation showing FANCI side chains within potential contact distance of the DNA (top), and molecular surface colored according to the electrostatic potential calculated with PYMOL (bottom, colored −5 to +5 kT blue to red). The proteins are colored according to their domains, in purple, gray and cyan for the FANCI NTD, HD and CTD domains, respectively, and brown, gray, pink for the FANCD2 NTD, HD and CTD domains, respectively. The end of the dsDNA binds to a semi-circular groove consisting of helices α33b, α36b, α37, α40 and α42 (secondary structure elements numbered as in the mouse ID structure32, with insertions denoted by letters after the helix number). This is analogous to the 7.8 Å crystallographic map of mouse FANCI bound to Y DNA, with the N-termini of helices and inter-helix loops providing multiple basic residues. The ICL-proximal portion of the duplex, which is absent from the shorter DNA used in the mouse FANCI crystals, is positioned against basic residues emanating from helices α15, α17 and α19b. The ssDNA rests against the sides of the α48 and α49 helices. The overall DNA density is of lower resolution than the surrounding protein, and in the refined model the DNA has high temperature factors suggesting it is significantly more mobile than the surrounding protein elements. Figure shows side chains for Arg287 on α15, Arg321, Lys336 and Lys339 on α17, Lys396 and Lys397 on α19b, Lys791, Lys793, Thr794 and Lys795 on α33b, Lys897, Lys898 and Lys902 on α36b, Lys980 on α40, Lys1026 on α42, Arg1178 on α46, and Lys1262, His1266, Lys1269 and Lys1270 on α48. b, FANCD2-DNA contacts are localized to the last four helical repeats of the CTD and a patch of basic residues on the NTD. Top figure shows the residues within contact distance of the DNA, colored as in a. The CTD residues involve the N-terminal portions of the inner helices of the helical repeats: Lys1172, Lys1174, Ser1175, Ser1178, Asn1179 and His1183 on α44, Arg1128, His1229 and Arg1236 on α46, Ser1287, His1288, His1292, Lys1296 and Tyr1297 on α48, and Thr1351, Arg1352, Gln1355 and His1356 on α50. NTD residues on α50 are Arg401, Arg404, Asn405 and Arg408. Bottom figure shows the corresponding molecular surface colored according to the electrostatic potential calculated with PYMOL (bottom, colored −5 to +5 kT blue to red). Note the absence of a basic patch at the HD-portion of the semi-circular groove (lower left portion of figure) compared to that of FANCI in a. c, Close-up view of the FANCD2 Arg1352 side chain in the DNA minor groove, and the residues that are in the vicinity of the flanking phosphodiester backbone.
d, Close-up view of c, showing the 3.8 Å cryo-EM density centered on Arg1352, shown in stick representation. Only a subset of the side chains shown in c are visible in this view (His1288, His1292, Lys1236, Lys1296, Gln1355 and His1356). e, Superposition of the DNA-binding region of FANCD2 (pink) CTD on the corresponding region of the FANCI paralog (cyan) showing the different orientations of the FANCI dsDNA (blue) and FANCD2 dsDNA (magenta) in the semi-circular grooves of the respective proteins. Residues 905–1269 of FANCD2 were aligned on residues 1058–1376 of FANCI with a 2.2 Å r.m.s.d. in the positions of 185 Cα atoms.
