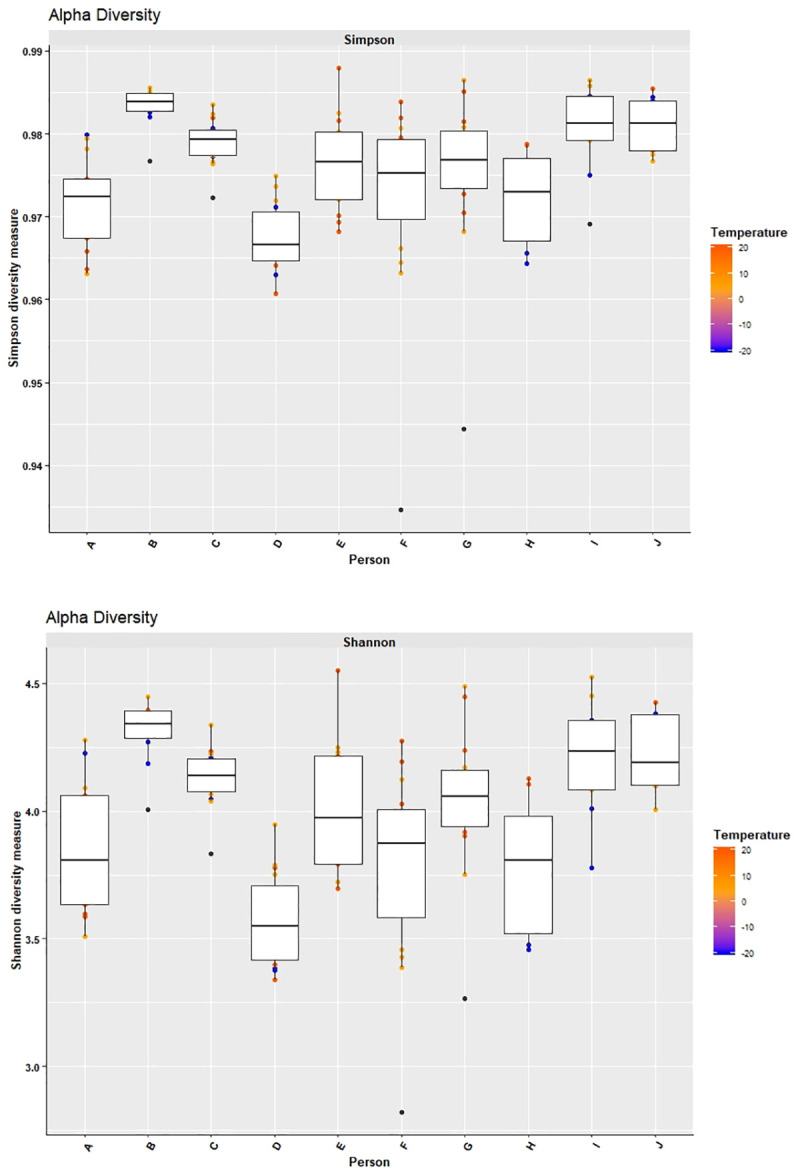
Fig 1.

Variation in alpha diversity (Simpson (A) and Shannon (B)) displayed as box plot of individuals A-J. Extended lines indicate variability outside the upper and lower quantity of the box, whereas outliers are plotted as individual points. Blue: immediately frozen samples, orange: 4°C, red: 20°C.
