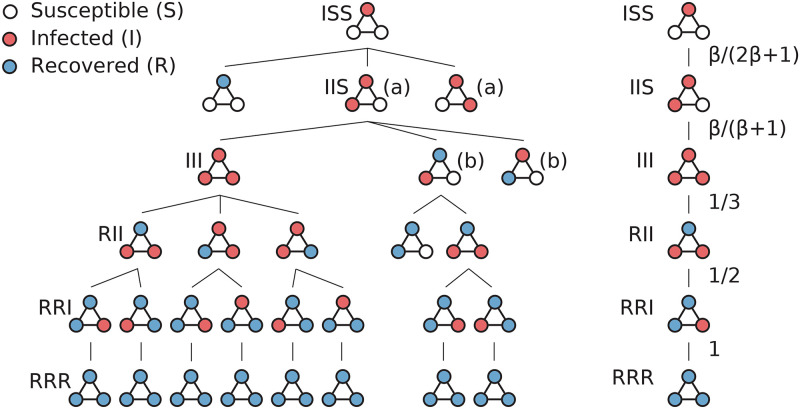
Fig 2. The unfolding of the SIR configuration tree.
(left) For the triangle graph with one initial infected node, the outbreak is a tree of configurations. The subtrees whose root nodes are labeled (a) unfold symmetrically (only one is shown); the same for (b). (right) For a path in the tree, the transition probabilities are shown.

