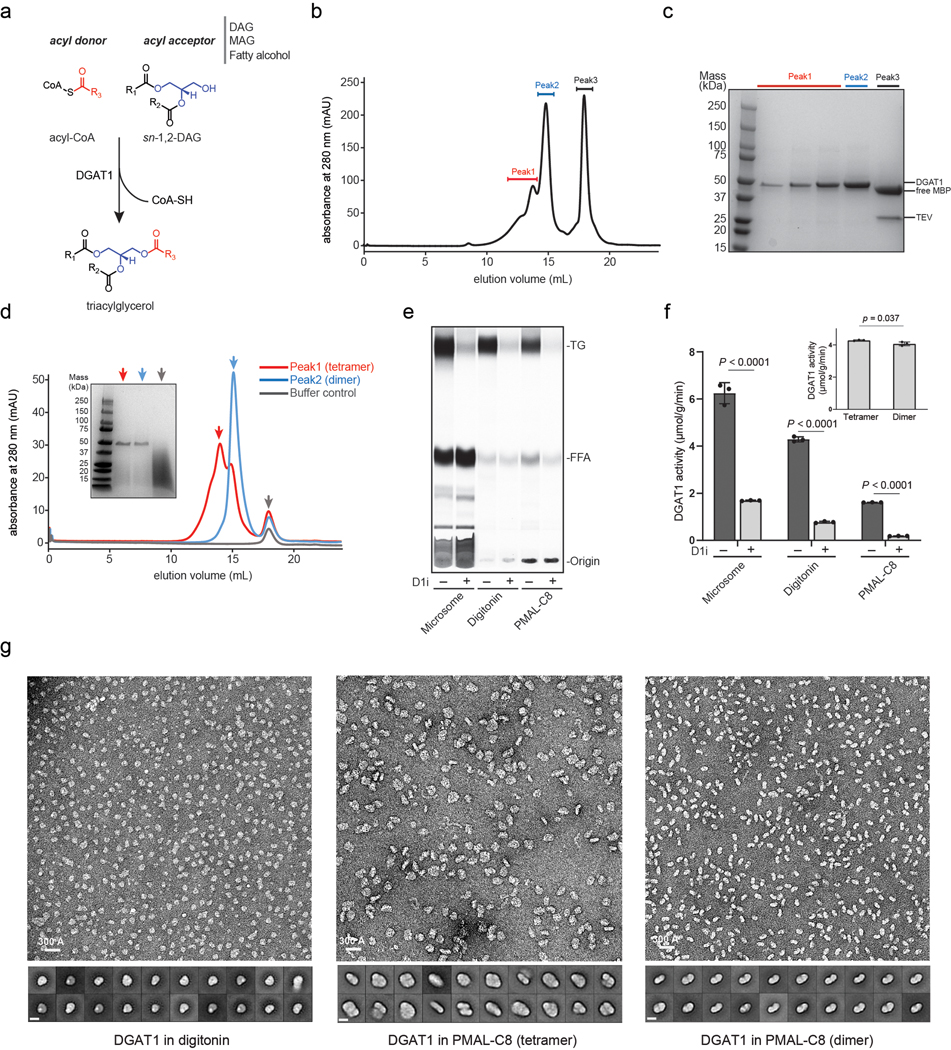
Extended Data Fig. 1 |. Purification and characterization of human DGAT1.

a, The acyl-transfer reaction catalyzed by DGAT1. The enzyme utilizes acyl-CoA as the sole acyl donor and recognizes different lipid molecules (i.e., diacylglycerol/DAG, monoacylcerol/MAG and fatty alcohol) as the acyl acceptor. The panel shows the reaction with sn-1,2-DAG as the acyl-acceptor and triacylglycerol/TG as the product. The acyl-group in acyl-CoA is colored in red, and the glycerol backbone in DAG is colored in blue. b and c, Gel-filtration profile and SDS-PAGE analysis of purified DGAT1 digitonin. The peak 1 and 2 containing purified DGAT1 by SDS-PAGE analysis were separately collected and pooled. d, Gel-filtration of DGAT1 reconstituted in the amphipol PMAL-C8 that was purified from b. A red (tetramer) and blue (dimer) arrow denote the different oligomerization states of DGAT1. The SDS-PAGE analysis of each peak is shown in the insert. e, Activity analysis of DGAT1-overexpressed microsome or purified enzyme with or without DGAT1 inhibitor (D1i). The protein from the digitonin sample of peak 2 in b and PMAL-C8 sample of the dimer peak in d were used for the assay. The reaction product of TG was separated and analyzed by TLC. FFA, free fatty acid. f, Quantification of TG product shown in e by phosphorimaging. The insert shows the activity of DGAT1 tetramer and dimer from d (mean ± SD, n=3 independent experiments). Analysis was performed using two-way ANOVA with Sidak’s post hoc test. g, Representative negative-stain EM micrograph and 2D averages of purified DGAT1 in digitonin (peak 2 in b), and the tetramer and dimer species of DGAT1 in PMAL-C8 (red and blue peaks in d), respectively. The bar in 2D average is 100 Å. Data shown in b-e and g were repeated at least three times with similar results.
