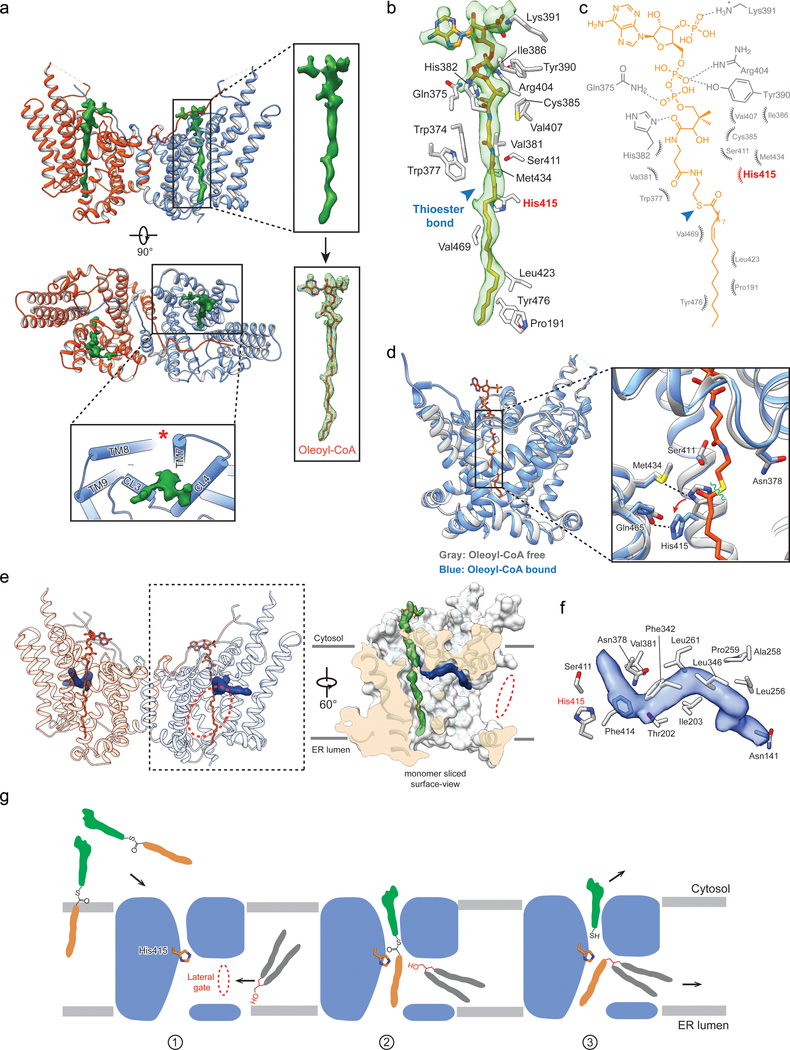
Fig. 3 |. Cryo-EM structures of DGAT1 complexed with a fatty acyl-donor substrate and a lipid-like molecule resembling an acyl-acceptor substrate.
a, Cryo-EM structure of human DGAT1 bound to an intact oleoyl-CoA molecule (green density at 3.5 σ contour level). Zoomed-in view shows the modeled oleoyl-CoA molecule superimposed with the EM density. Lower panel illustrates the cytosolic tunnel of DGAT1, consisting of TMs 7–9 and CL3–4, that interacts with oleoyl-CoA substrate. Red asterisk indicates the gap between TM7 and TM8 in the cytosolic membrane leaflet. b and c, Interactions between oleoyl-CoA and DGAT1. Residues interacting with oleoyl-CoA within a 4-Å distance are shown. Detailed molecular interactions are depicted in c. Polar interactions (dashed lines) and interaction distances are labeled. Non-dipolar interactions are shown as spiked arcs. Blue arrowhead indicates the thioester bond in acyl-CoA substrate. d, Conformational changes in the DGAT1 active center upon oleoyl-CoA binding. Red arrow indicates the His415 conformational change before (gray) and after (blue) oleoyl-CoA binding, and dashed lines indicate the hydrogen bonds between His415 and Met434 without oleoyl-CoA and between His415 and Gln465 (2.4 Å) upon binding to oleoyl-CoA. Asn378 that is essential for DGAT1 activity is also shown. Green wavy line indicates the scissile bond in the thioester group during acyl-transfer reaction. e, Unidentified lipid-shaped density (blue) residing in the DGAT1 central cavity. The lateral gate (red dashed circle) and oleoyl-CoA molecules (sticks) are shown. Right panel is a surface representation to show orientation of the lipid-like density in the monomer of DGAT1/acyl-CoA complex structure. f, Residues accommodating the lipid-like density (transparent blue surface) shown in the acyl-CoA free DGAT1 structure. g, Hypothetical model for DGAT1-catalyzed TG formation. See text for details.

