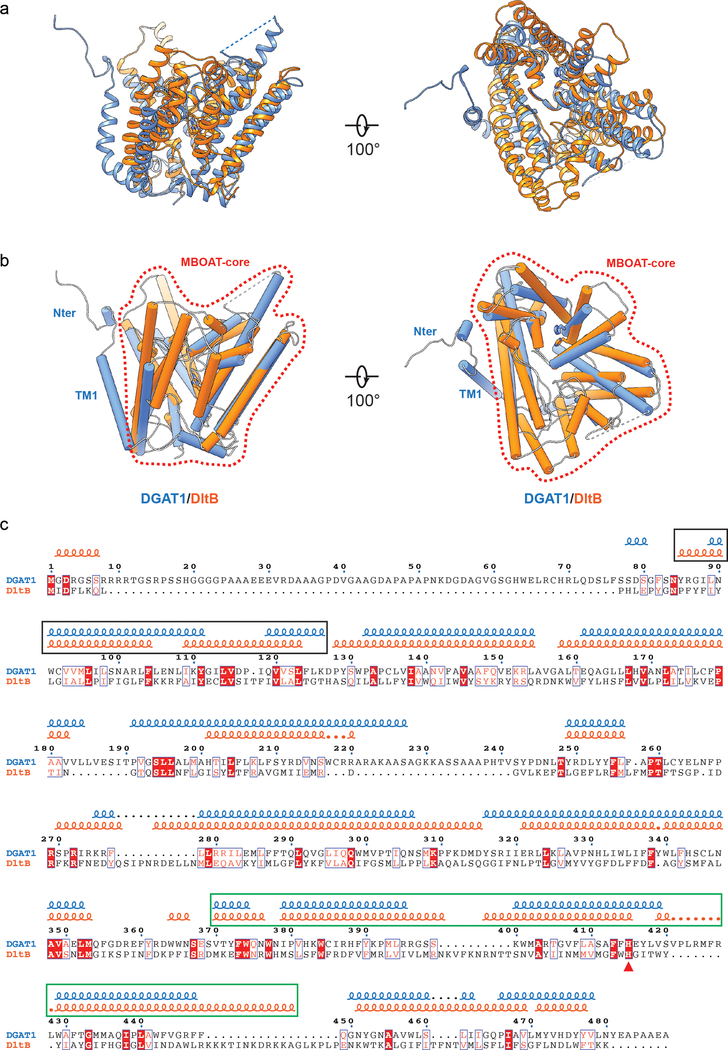
Extended Data Fig. 5 |. Structural comparison of DGAT1 with DltB.
a, Structural superposition of DGAT1 (blue) and DltB (orange, PDB ID: 6BUI)17. The two structures were superimposed with an rmsd of 1.39 Å over 360 matched Cα positions. b, Same as a but the protein structures were shown as cylinders with the conserved histidine shown as sticks. The area denoted by the red dashed line exhibits a similar overall architecture among DGAT1 and DltB (MBOAT-core) that is not found in other protein structures. Note that beyond this common area, the resolved N-terminal and TM1 region in DGAT1 appear as extra structural elements beyond the MBOAT-core region as compared to DltB. c, Structure-based sequence alignment of DGAT1 and DltB. The squiggles on the top represent α-helices in DGAT1 (blue) and DltB (orange). Sequences in the black rectangle indicate the most structurally variable region in the two enzymes. In DGAT1, these regions are involved in dimer formation, whereas in DltB, the equivalent two helices (TM1 and TM2) seal off the lateral cavity within the membrane (see main text). Sequence in green rectangle denotes the alanyl-donor binding pocket in DltB. The red triangle denotes the conserved histidine. The alignment was performed with PROMALS3D43, and the final alignment figure was generated with ESPript 3.044.

