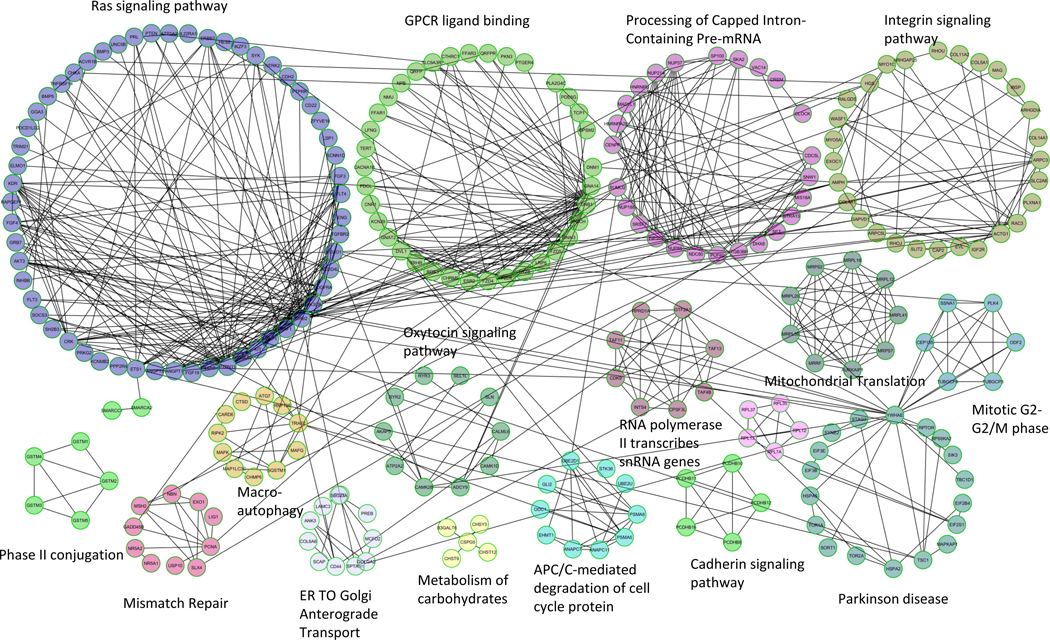
FIGURE 2.
CTRD unique gene interaction network using ReactomeFIViz. Top function within each cluster is highlighted at the top of each cluster. To simplify figure presentation, we annotated each module using its top enriched function or more abundant functional categories to illustrate each module’s functional characterization. Different connecting lines represent different biological events as illustrated in the legend in the figure

