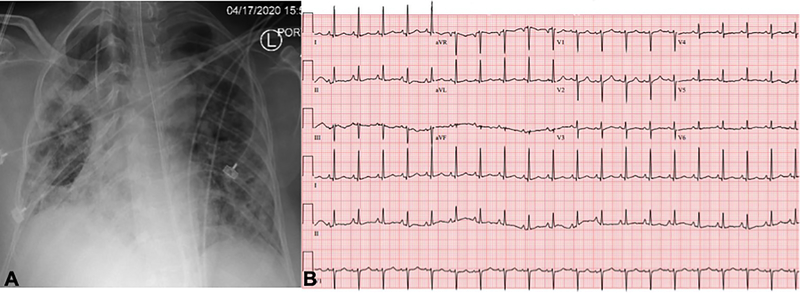
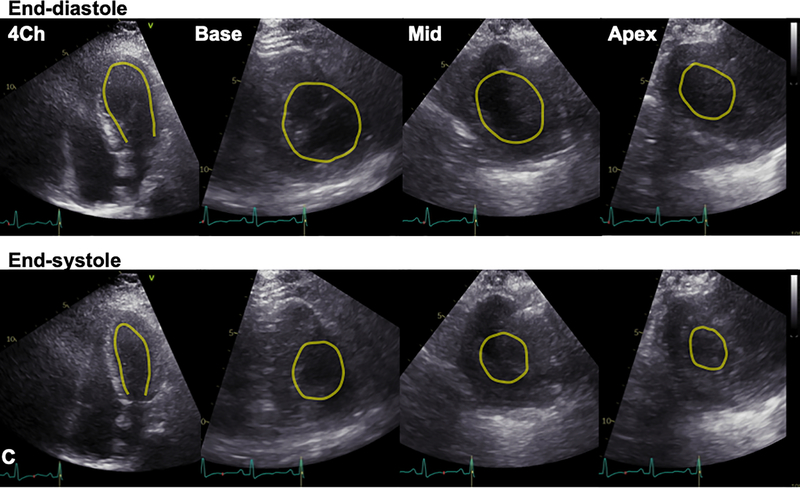
Figure 2. Recovery of stress cardiomyopathy during clinical improvement.
Panels A-C demonstrate data obtained on the day of extubation, 10 days following data in Figure 1. A. CXR continued to demonstrate pulmonary infiltrates. B. ECG abnormalities had normalized compared to prior. C. TTE demonstrated recovery of LV systolic function with resolution of regional dysfunction (L-R: 4-chamber and short-axis basal, mid, and apical images; top panel: end-diastole; bottom: end-systole). Yellow contours outline the LV endocardial borders.


