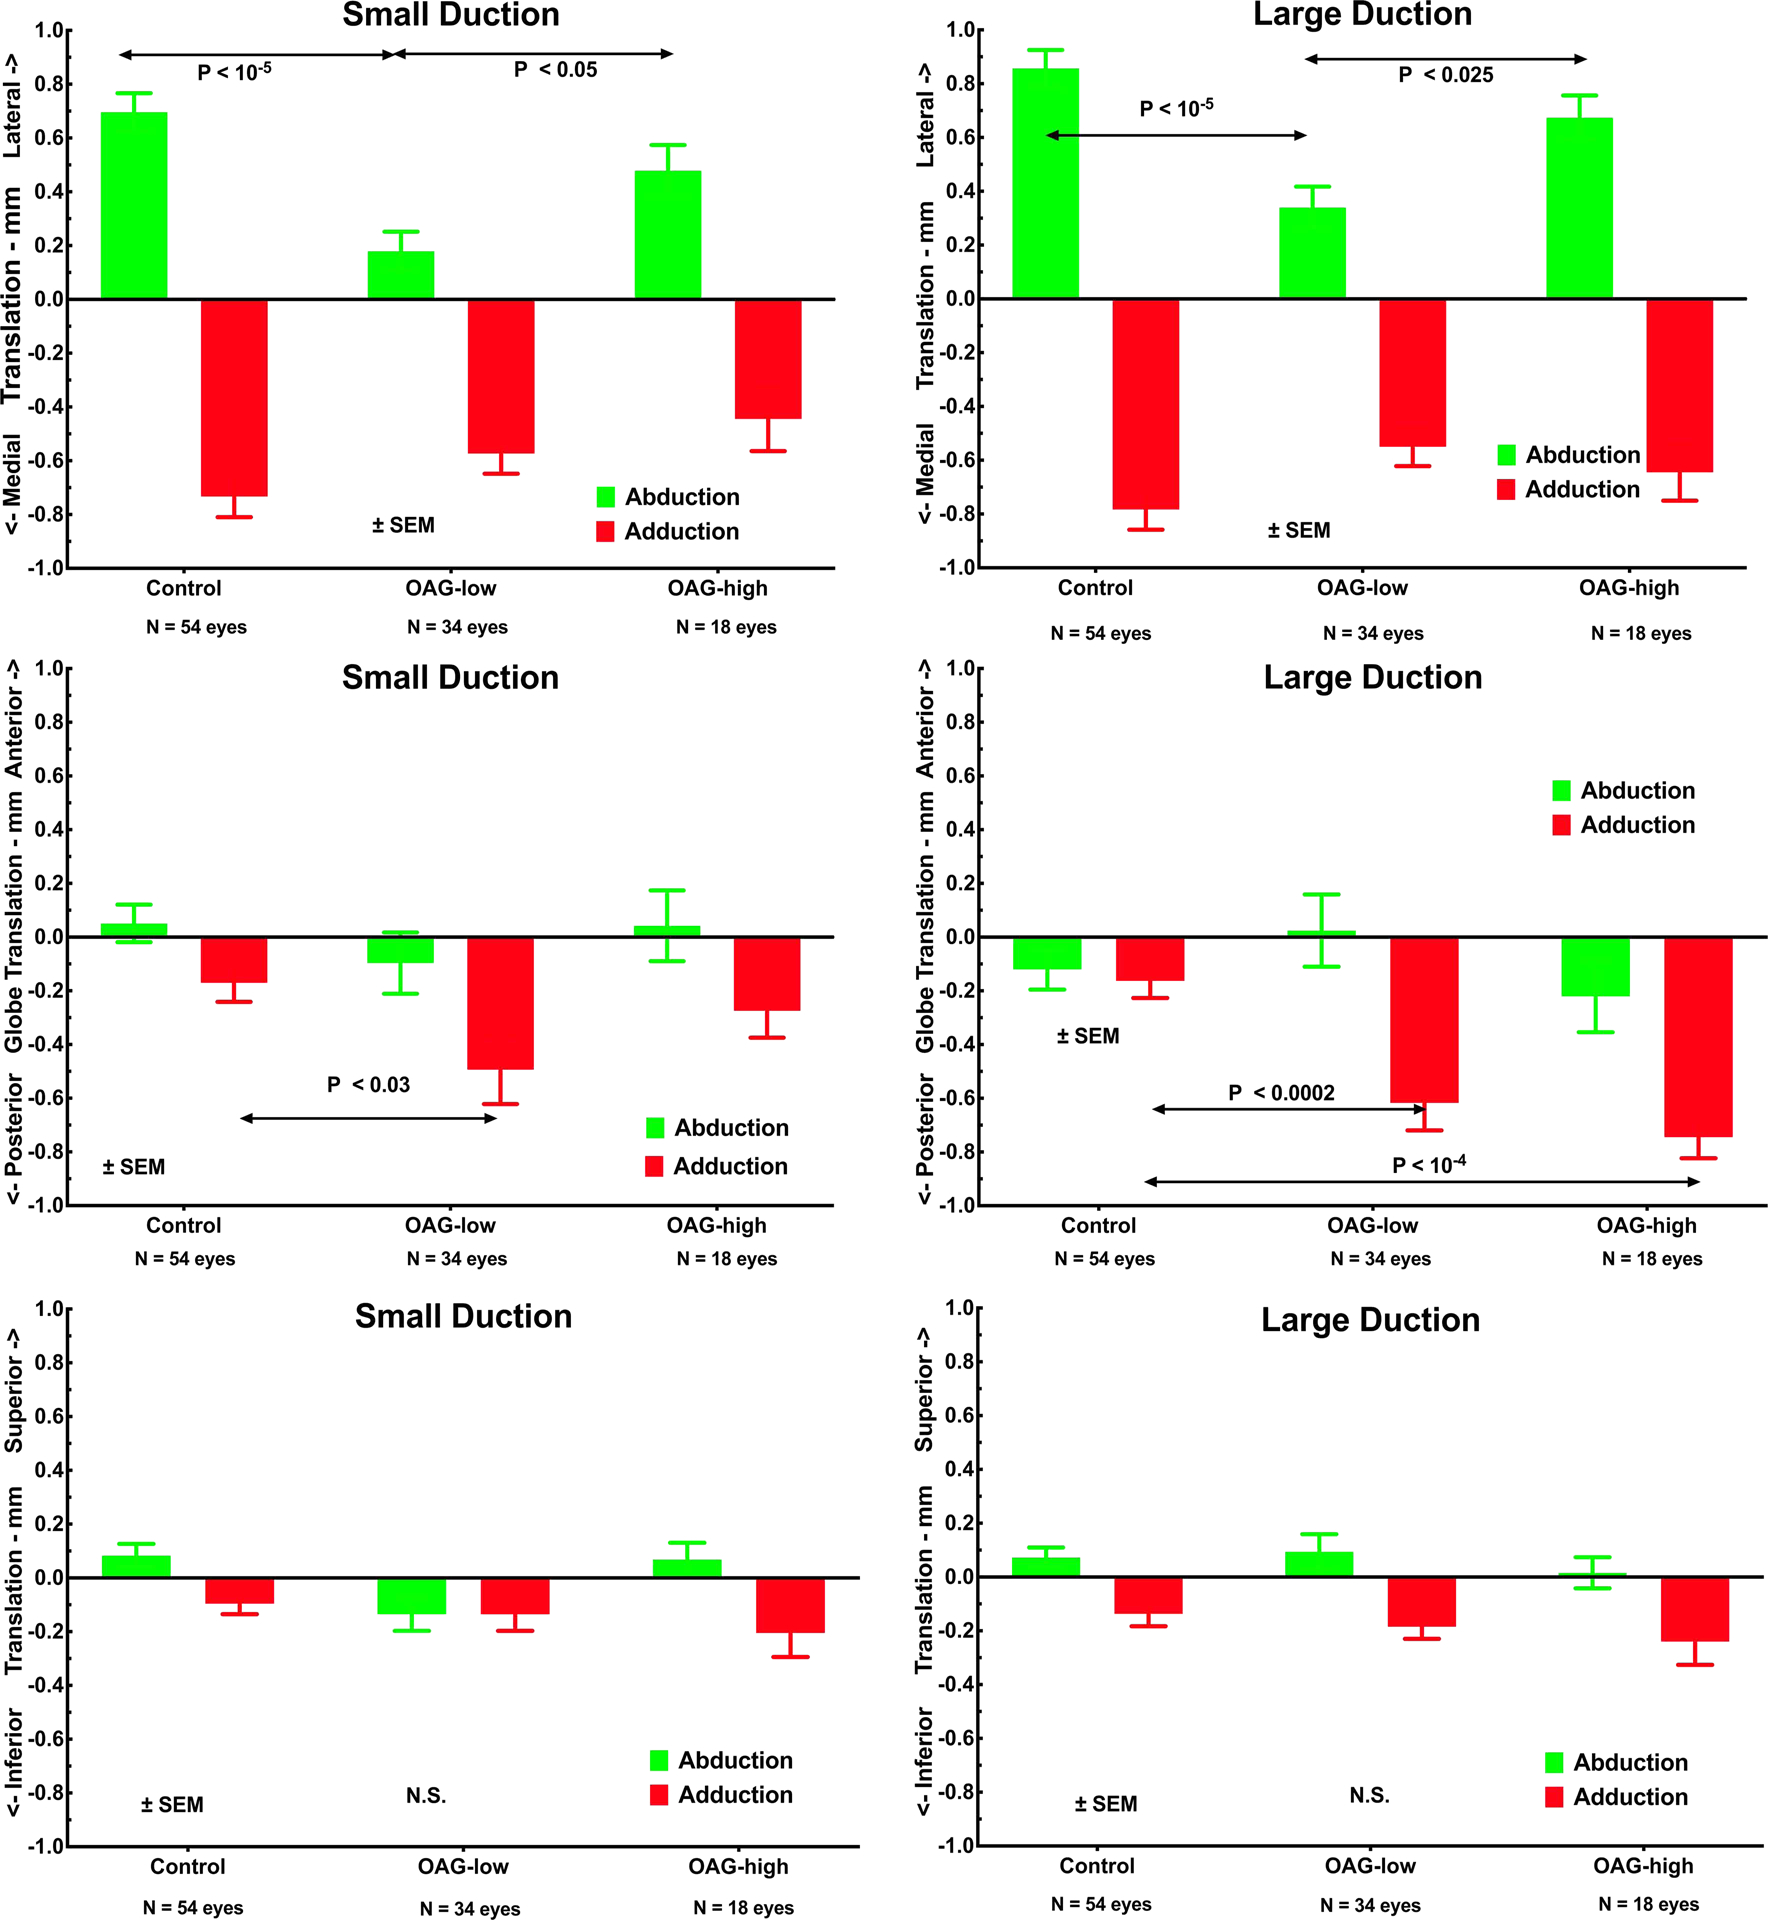
Fig. 3.

Globe translation during small and large ductions to the angles specified in Fig. 2. Upper row illustrates significantly less mediolateral translation during horizontal duction in OAG-low than in controls or OAG-high patients. Middle row shows greater posterior globe translation (retraction) than normal in OAG-low for small adduction, and for both OAG-high and OAG-low in large adduction, without significant difference in abduction. Lower row illustrates absence of significant vertical globe translation during horizontal duction in any subject group. SEM – standard error of mean. P values by t-testing.
