Figure 4.

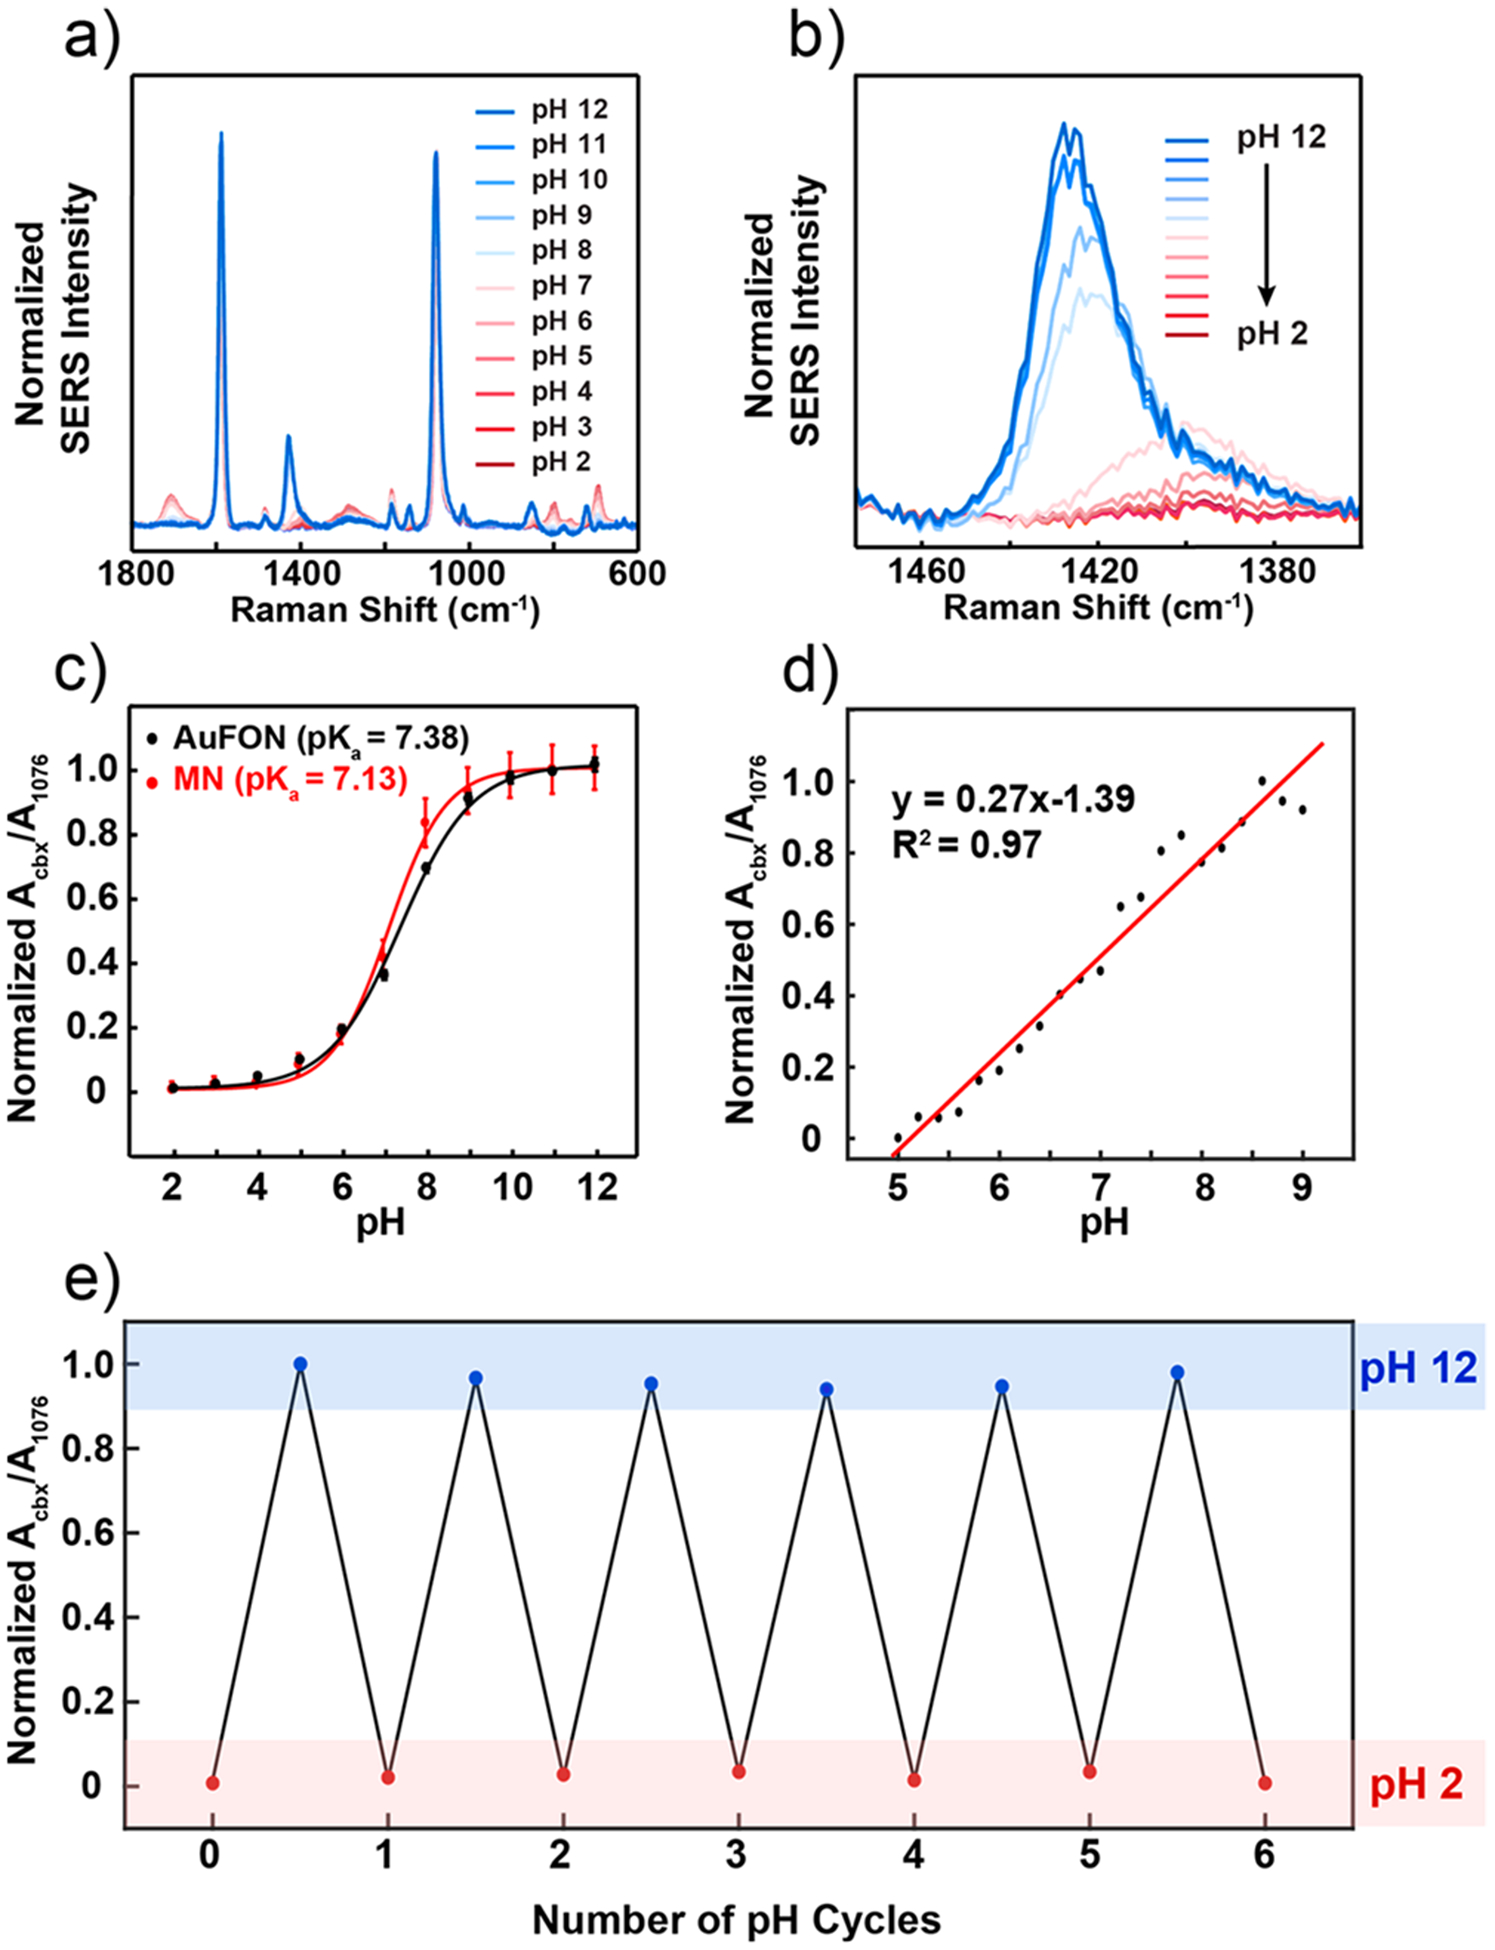
SERS activity of the plasmonic microneedle array. (a) SER spectra of 4-MBA on the plasmonic microneedle array in Britton-Robinson buffers (pH 2–12) with 1 pH unit increments. (b) Magnified spectra centered around the pH-sensitive 1400 cm−1 peak. For each pH level, seven spectra were collected from separate microneedle tips and averaged. (c) Calibration curve for the plasmonic microneedle array (MN, red trace) and for a standard SERS substrate (AuFON, black trace) over the entire pH 2–12 range. Error bars represent standard deviation. For MNs, seven spectra per pH increment were collected and averaged from three different samples (n = 3). For the AuFON, five spectra were collected from different spots across one sample per pH increment (n = 5). The parameters for the SER collection were λex = 785 nm, tacq = 1 min, Pex = 1 mW for MNs, and λex = 785 nm, tacq = 1 min, Pex = 270 μW for AuFON. (d) Calibration curve for the linear response range (pH 5–9) for the plasmonic microneedle array collected with 0.2 pH unit increment. (e) Cycling the pH (pH 2–12) of the plasmonic microneedle array environment demonstrating the reversibility of the sensor (six cycles).
