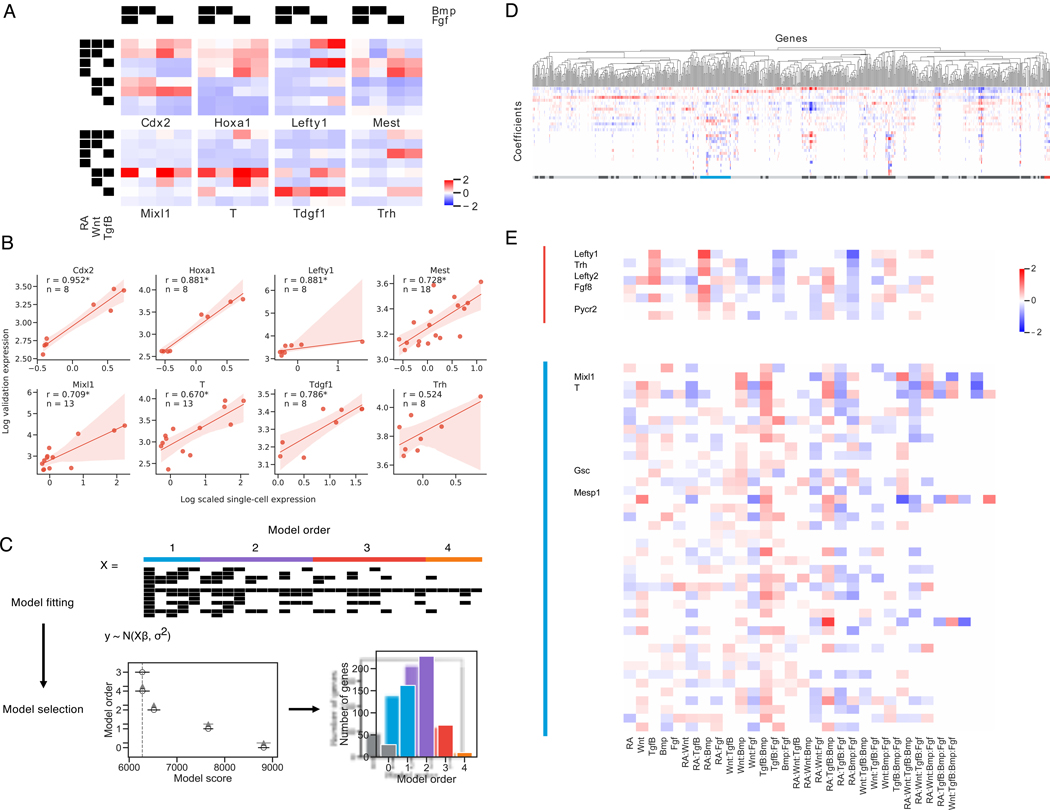
Figure 3. Gene expression at the germ layer stage requires highly complex interactions between signaling pathways.
(A) Mean scaled gene expression of genes chosen for validation of cells that observed different treatment combinations
(B) Correlation of average scRNA-seq expression with GFP expression for reporter cell lines. Spearman rank correlation coefficient is reported for each gene and is significant at p < 0.05 for all genes except Trh. 95% confidence intervals are estimated via bootstrap (n = 1000).
(C) Schematic of Bayesian regression analysis framework. Model fitting: X is a covariate matrix with order of each term annotated above. Black indicates 1. Models are fit with varying orders of terms included. Model comparison: Model comparison plot for an example gene, with model order on the y-axis and estimate of model fit on the x-axis. The vertical grey-dashed line indicates the score of the best model fit. Empty circles indicate the mean score of that model, black horizontal lines indicate the standard deviation of the score, and grey horizontal lines indicates the standard deviation of the difference between the score of that model and the best model. (See methods) Lower scores imply a better model fit.
(D, E) Hierarchical clustering of top 2000 most variable genes. Clusters are annotated beneath with alternating dark/light grey. The Lefty1 cluster (red, *) and T/Mixl1 cluster (blue, **) are magnified and relevant genes indicated See also Figure S3

