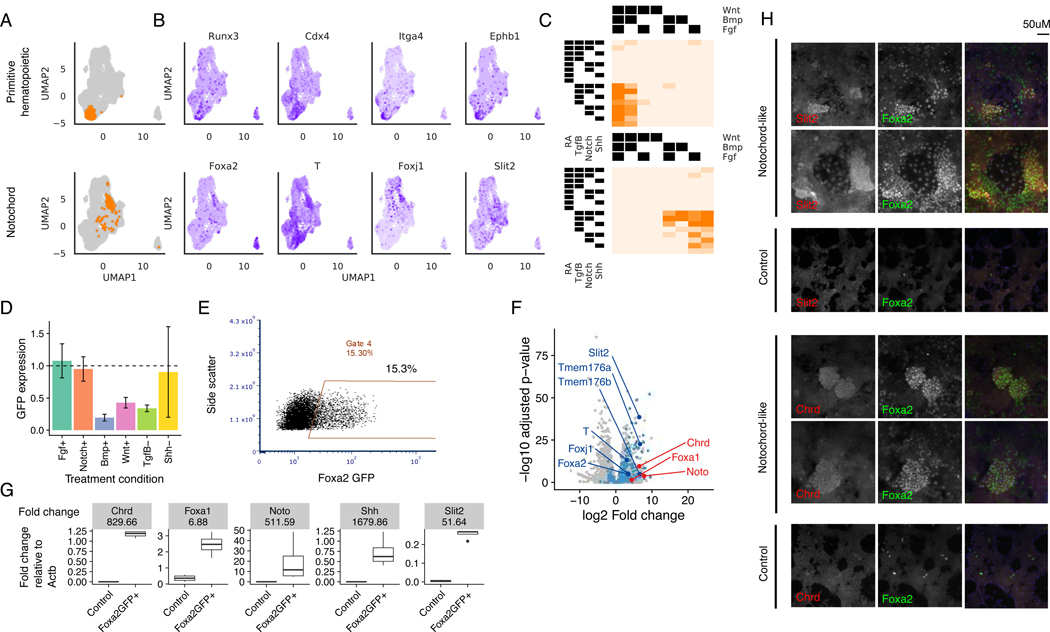
Figure 7. Cells expressing notochord markers are selected for by activating Tgfβ+.
(A) Stable clusters of cells identified by unsupervised clustering analysis
(B) Expression of gene markers identified for each cell type classifier visualized on the UMAP. Gene markers shown are differentially expressed with respect to the rest of the cell population at q-value < 0.05
(C) Fraction of cells assigned to each treatment combination that belong to the corresponding cluster in (A)
(D) Average and standard deviation of flow cytometric Foxa2-GFP expression normalized to the Tgfβ+Shh+Fgf-Bmp-Notch-Wnt baseline.
(E) Flow cytometry plots showing Foxa2-GFP expression in the presence of RA-Wnt-Bmp-Tgfβ+
(F) Differential expression analysis of bulk RNA-seq expression of Foxa2+ putative notochord cell population vs. control cells. Dots colored in blue are genes that were also found to be significantly differentially expressed with positive fold change in barRNA-seq at corrected p-value < 0.05. Annotated dark blue dots are known notochord markers. Dots colored in red are additional notochord markers found to be significantly differentially expressed in the bulk RNA-seq with adjusted p-value < 0.05.
(G) RT-qPCR of notochord markers in FoxaGFP+ and control cell populations. Up-regulation of all notochord markers is significant by t-test at p-value < 0.05 on log RT-qPCR normalized expression.
(H) Immunofluorescence staining of notochord markers in notochord-like and control differentiation conditions. All panels are 20X-magnified, Hoechst 33342 is included in the merged panels.

