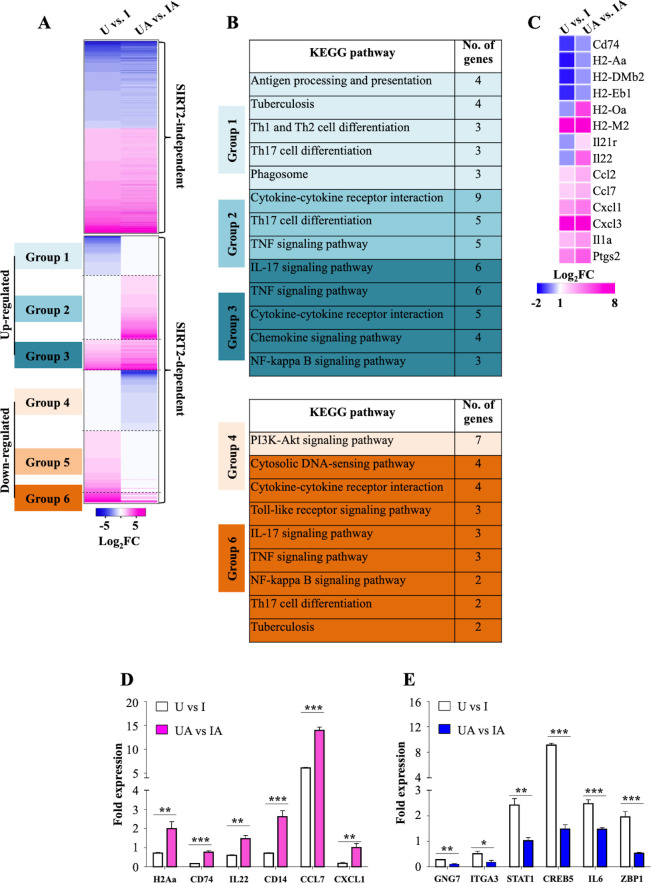
Figure 3. SIRT2 modulates host gene transcription during Mtb infection.
(A) Heatmap interpretation of gene expression changes (Log2 fold) as determined by RNAseq analysis of peritoneal macrophages infected with Mtb for 24 hr. Pink depicts upregulation while blue represents repression. (B) KEGG analysis of molecular signaling pathways affected by AGK2 treatment. (C) Heatmap representing the expression profile of the genes involved in T cell activation. qRT-PCR of candidate genes which are either (D) up- or (E) downregulated in SIRT2 dependent manner. . U: Uninfected. UA: Uninfected treated with AGK2. I: Infected. IA: Infected with AGK2 treatment. RNAseq was performed in three biological replicates. Each bar in (D) and (E) represents mean ± SD (n = 3). *p<0.05, **p<0.005, ***p<0.0005.

