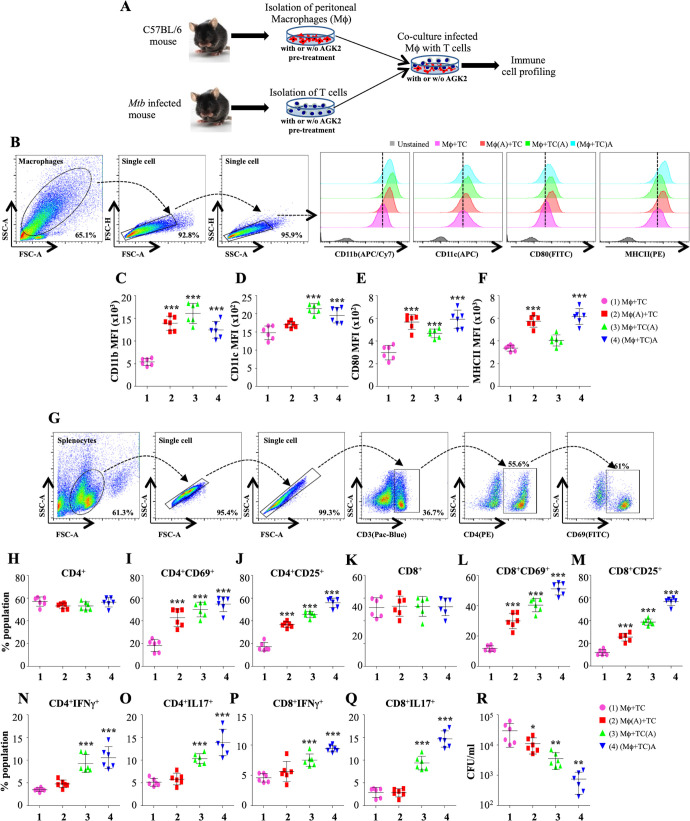
Figure 4. SIRT2 inhibition activates macrophages and T cells to induce pro-inflammatory response.
(A) Schematic representation of the experimental plan (for details see Materials and methods). 48 hr post co-culture, macrophages were stained with CD11b (APC/Cy7), CD11c (APC), CD80 (FITC) and MHC-II (PE) followed by flow cytometry analysis. (B) Gating strategy employed and representative overlay plots to depict macrophage activation. Expression of (C) CD11b, (D) CD11c, (E) CD80 and (F) MHCII on the surface of peritoneal macrophages. (G) Gating strategy for T cell activation. Splenocytes were stained for surface markers CD3 (Pacific Blue), CD4 (PE), CD8 (APC/Cy7), CD69 (FITC) and CD25 (APC) followed by flow cytometry. Percentage of (H) CD4+, (I) CD4+CD69+, (J) CD4+CD25+, (K) CD8+, (L) CD8+CD69+ and (M) CD8+CD25+ T cells. For cytokine analysis, splenocytes were stained with CD3 (Pacific Blue), CD4 (PE), CD8 (APC/Cy7), IFNγ (APC) and Il17 (PE/cy7). (N and O) Intracellular cytokines (IFNγ and IL17) expressed by CD4+ T cells. (P and Q) CD8+ T cells expressing IFNγ and IL17. (R) CFU at 48 hr post co-culture. Combined data from two independent experiments performed in triplicates is shown. Each bar represents mean ± SD (n = 6). Statistical analysis performed using one-way ANOVA followed by Tukey post hoc test. *p<0.05, **p<0.005, ***p<0.0005.

