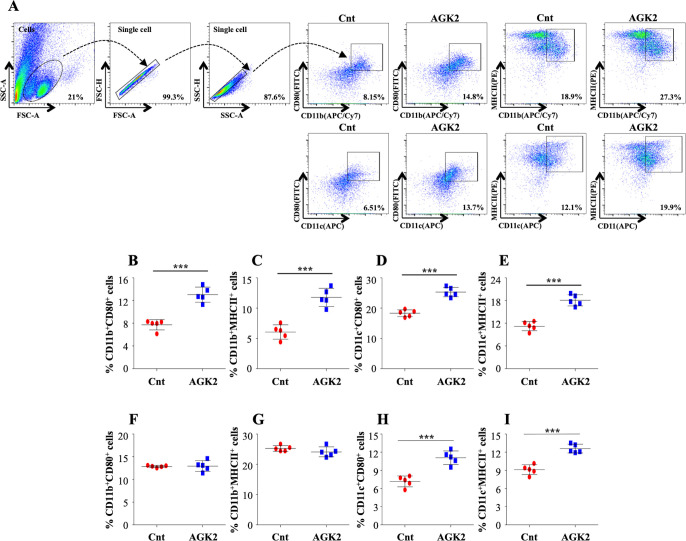
Figure 7. Inhibition of SIRT2 activity enhances macrophage stimulation in the lungs and spleen of infected animals.
(A) After overnight stimulation with CSA, the cells isolated from the lungs of infected C57BL/6 animals were surface stained with CD11b (APC/Cy7), CD11c (APC), CD80 (FITC) and MHC-II (PE) followed by flow cytometry analysis. Gating strategy employed and flow cytometry dot plots of CD11b+CD80+, CD11b+MHCII+, CD11c+CD80+, CD11c+MHCII+ cells in the lungs of infected mice (B–E) Percentage of (B) CD11b+CD80+, (C) CD11b+MHCII+, (D) CD11c+CD80+ and (E) CD11c+MHCII+ cells in the lungs. (F–I) Percentage of CD11b+CD80+, CD11b+MHCII+, CD11c+CD80+, CD11c+MHCII+ cells in the spleen of infected mice. Data is representative of two independent experiments with five mice per group. Each graph represents mean ± SD (n = 5). ***p<0.0005.

