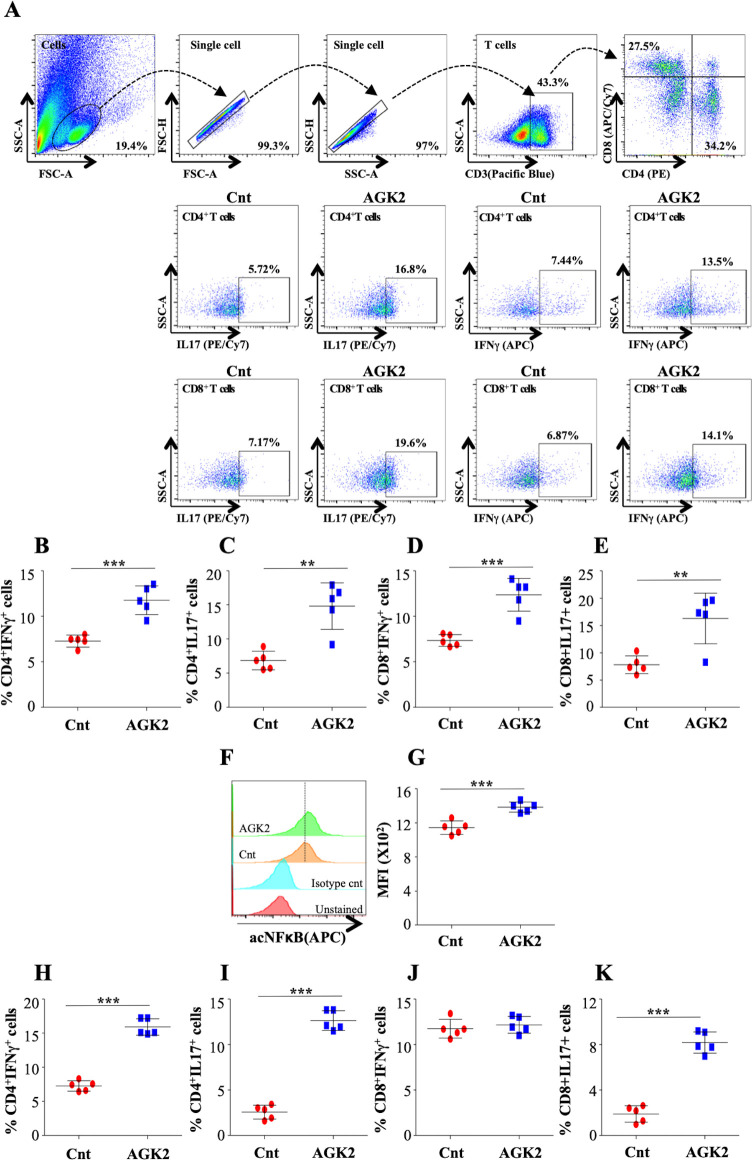
Figure 9. AGK2 treatment induces host protective immune responses against TB.
Cells isolated from infected lungs of C57BL/6 mice were stained with CD3 (Pacific Blue), CD4 (PE), CD8 (APC/Cy7), IFNγ (APC) and IL17 (PE/cy7) followed by flow cytometry. (A) Gating strategy and representative flow cytometry dot plots. Percentage of IFNγ and IL17 producing CD4+ (B and C) and CD8+ (D and E) T cells in the lungs of infected mice. (F) Overlay plots and (G) quantification of acetylated NFκB p65 levels in the CD3+ T cells isolated from the lungs of infected mice. (H–K) IFNγ and IL17 expressing CD4+ (H and I) and CD8+ (J and K) T cells in the spleen of infected mice. The experiment was performed twice with five mice in each group. Data is represented as mean ± SD (n = 5). **p<0.005, ***p<0.0005.

