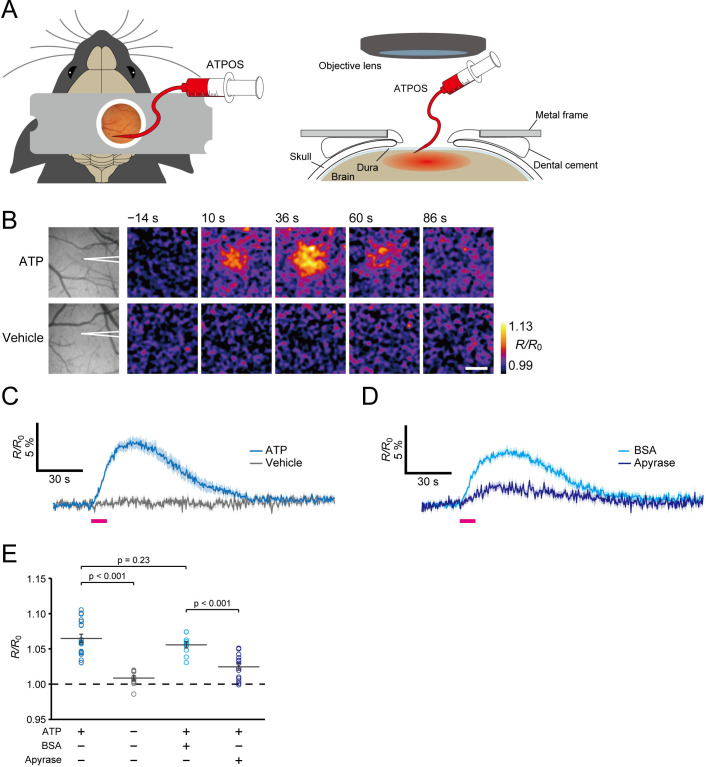
Figure 3. Imaging of extracellular ATP in mouse cerebral cortex.
(A) Schematic illustration of application of ATPOS to the mouse cerebral cortex: top (left) and side (right) views. ATPOS is pressure-injected with a fine glass pipette through a cranial window. (B) Representative images showing the ratiometric fluorescence response (R/R0) of ATPOS upon application of 10 mM ATP (top) or vehicle (bottom). The position of the glass pipette for ATP injection is depicted in the left panels. Time after the start of injection is presented above the images. Scale bar, 250 μm. (C) Averaged traces of the ratiometric fluorescence response (R/R0) of ATPOS upon application of 10 mM ATP (blue; n = 18 from five mice) or vehicle (gray; n = 11 from three mice). Magenta bar indicates the application of ATP or vehicle. Shaded regions represent SEM. (D) Averaged traces of the ratiometric fluorescence response (R/R0) of ATPOS upon application of 10 mM ATP (magenta bar) in the presence of bovine serum albumin (BSA) (light blue; n = 10 from three mice) or apyrase (dark blue; n = 14 from three mice). Shaded regions represent SEM. (E) The peak amplitudes of the ratiometric fluorescence response (R/R0) of ATPOS upon application of ATP (blue) or vehicle (gray) in the absence or presence of BSA (light blue) or apyrase (dark blue). Wilcoxon’s rank-sum test was performed. Data are presented as mean ± SEM.


