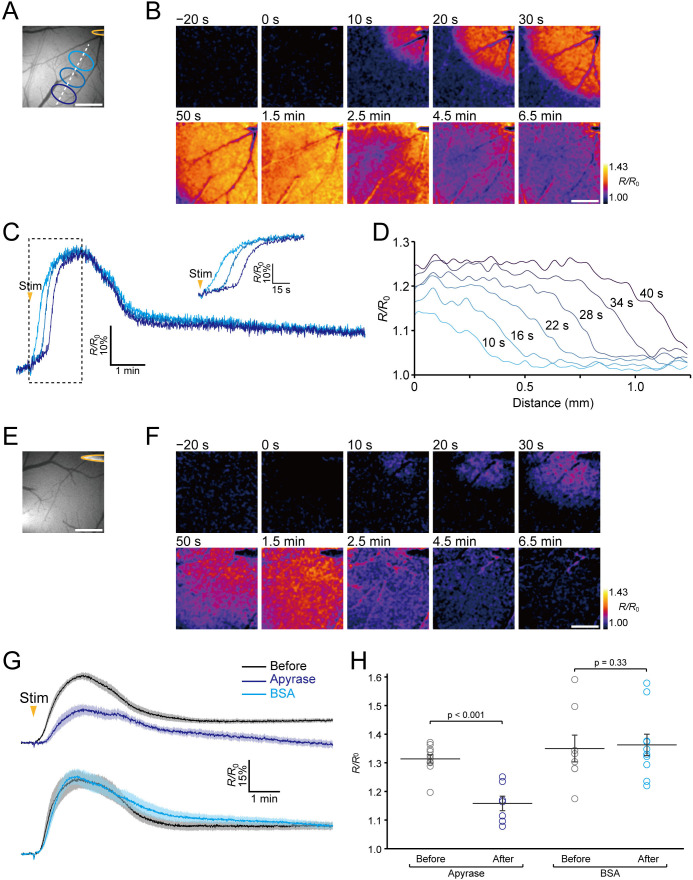
Figure 4. Imaging of extracellular ATP signaling during neuronal excitation.
(A) The position of the stimulating electrode (yellow) and locations of ROIs. (B) Representative images of the ratiometric fluorescence response (R/R0) of ATPOS to electrical stimulation. The time after the initiation of stimulation is presented above the images. Scale bar, 500 μm. (C) Time courses of the ratiometric fluorescence response (R/R0) of ATPOS extracted from the ROIs depicted in (A). The inset shows a magnified view. (D) The spatial distribution of ratiometric fluorescence response (R/R0) of ATPOS along the line depicted in (A). The time relative to the stimulation onset is presented above the lines. (E) The position of the stimulating electrode. (F) Images of the ratiometric fluorescence response (R/R0) of ATPOS upon electrical stimulation in the presence of apyrase. Time after the initiation of stimulation is presented above the images. Scale bar, 500 μm. (G) Averaged traces of the ratiometric fluorescence response (R/R0) of ATPOS to electrical stimulation before (black; n = 11 from five mice) and after the application of apyrase (dark blue; n = 7 from five mice) (upper), and before (black; n = 8 from four mice) and after the application of BSA (light blue; n = 10 from four mice) (lower). Shaded regions represent SEM. (H) The peak amplitudes of the ratiometric fluorescence response (R/R0) of ATPOS upon electrical stimulation before (black) or after the application of apyrase (dark blue) or BSA (light blue). Wilcoxon’s rank-sum test was performed. Data are presented as mean ± SEM.


