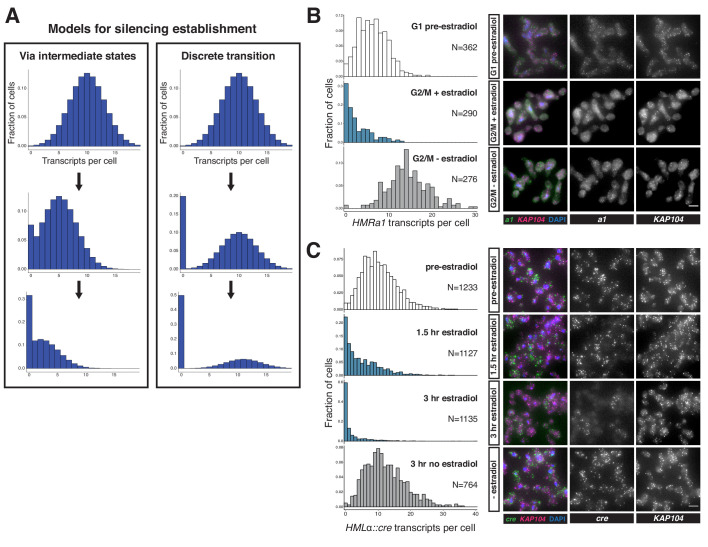
Figure 2. Silencing establishment proceeded via gradual repression in individual cells.
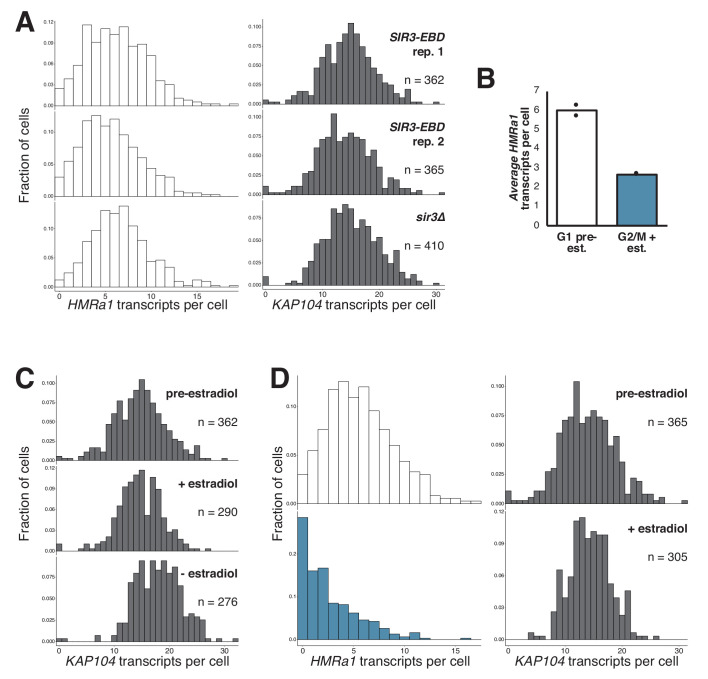
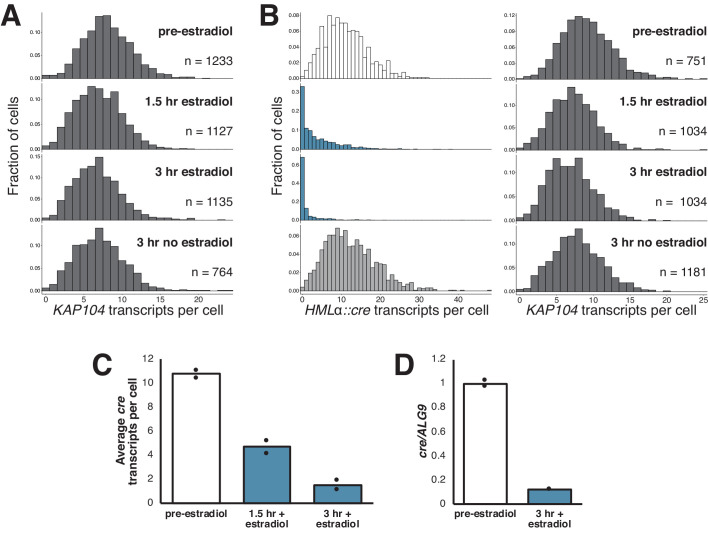
(A) Potential models for silencing establishment. Before silencing establishment (top), mRNA transcripts are present as a distribution around a mean. If silencing establishment occurred via intermediate states (left), the mean number of transcripts per cell would decrease over time, with complete silencing, that is zero transcripts per cell, occurring as the probability distribution shifted toward the y axis. If silencing establishment occurred via discrete transitions (right), an increasing fraction of cells would have zero transcripts over time, but the distribution of cells with >0 transcripts would retain the same shape. (B) smRNA-FISH for HMRa1 during silencing establishment after 1 s phase. A SIR3-EBD culture (JRY11762) was arrested in G1 with α factor (‘G1 pre-estradiol’), then split and released to G2/M by addition of protease and nocodazole in the presence of either estradiol or ethanol. Samples were collected 2 hr after estradiol addition. (C) smRNA-FISH for HMLα::cre during silencing establishment in cycling cells. A SIR3-EBD strain bearing the HMLα::cre reporter (JRY12514) was grown to mid-log phase (‘pre-estradiol’), then the culture was split in two, with one sub-culture receiving estradiol and the other receiving ethanol. Samples were collected for smRNA-FISH at t = 1.5 hr and t = 3 hr after estradiol addition. For both (B) and (C), the images displayed are representative maximum-intensity Z-projections. The data shown in (B) and (C) each represent one of two replicate experiments, for which the other replicate is shown in Figure 2—figure supplements 1 and 2, respectively. Scale bars = 5 µm.


