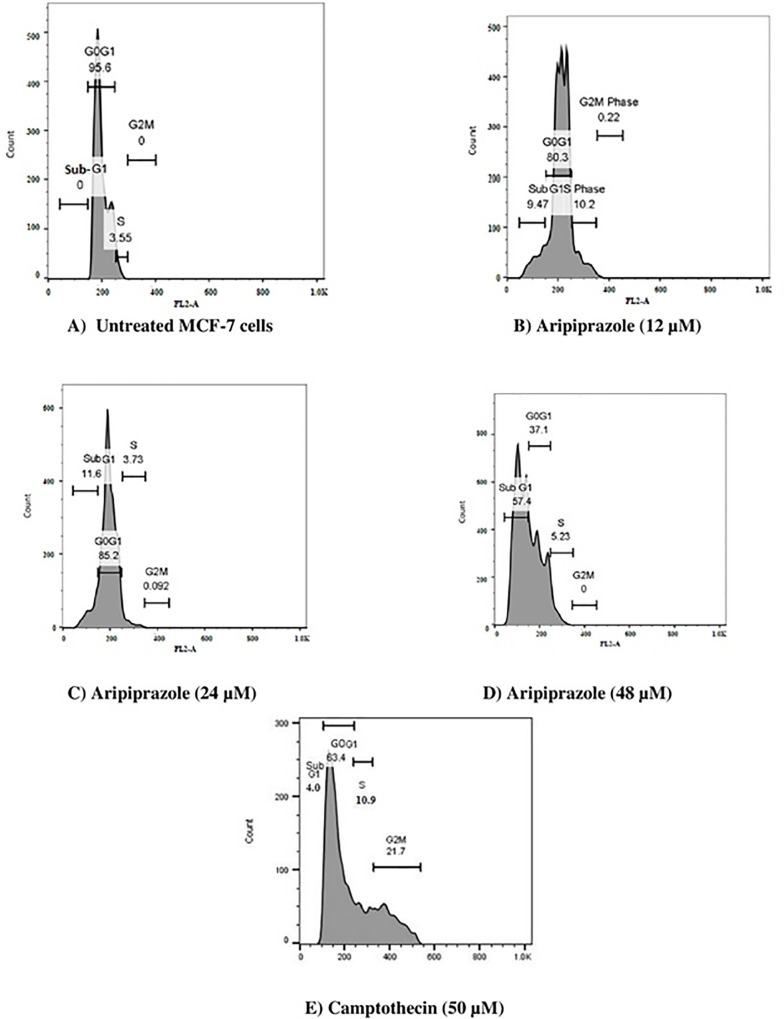
Fig 6. Cell cycle distribution of MCF-7 cells showing percent histogram after 48 hours of treatment.
A) Untreated MCF-7 cells showing no cell population in subG0G1 phase, B) Aripiprazole (12 μM) cells showing 9.47% cell population in subG0G1, C) Aripiprazole (24 μM) cells showing 11.6% cell population in subG0G1 phase, D) Aripiprazole (48 μM) cells showing 57.4% cell population in subG0G1 phase, and E) Camptothecin (50 μM) cells showing 4% cell population in subG0G1 phase Total 10,000 cells were analyzed in triplicate during sample acquisition.

