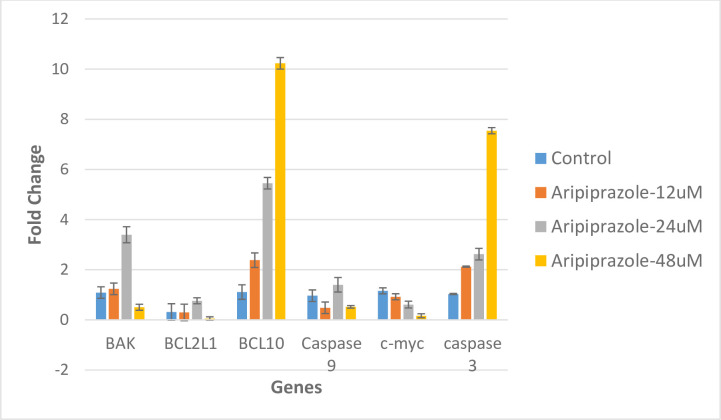
Fig 7. Graphical representation of fold change in mRNA expression.
mRNA expression of caspase 3, caspase 9, c-myc, BAK1, BCL 1and BCL-10 calculated by comparative CT method (2-ΔΔCT Method) after the treatment of aripiprazole and camptothecin. β-actin and GAPDH were used as a control gene. CT values were obtained, data was normalized against actin and fold change was calculated by ΔCT method. The data are mean ± S.E.M. of three independent experiments, P-values, (***P< 0.001, ** P<0.001 and * P<0.05).

