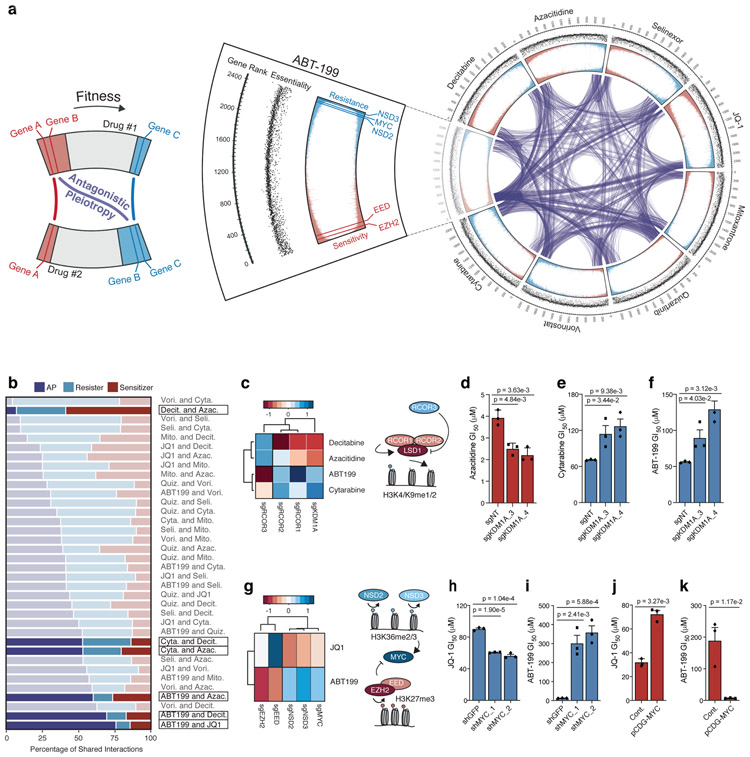
Figure 2: Analysis of drug-induced antagonistic pleiotropy reveals gene-gene and drug-drug interactions.
a, Circos plot displaying data from drug-modifier CRISPR screens. Screen conducted in presence of ABT-199 shown as cutout with annotations from outermost rim: genes ranked from most sensitizing (rank = 1) to most resisting (rank = 2,390); scatterplot of corresponding gene essentiality score; drug-modifier score (shown in replicate), colored to depict sensitizers (red) and resisters (blue). Gene-gene relationships that exhibit AP between drug screens indicated by purple connections. b, Breakdown of shared sensitizer, shared resister and AP gene interactions between 36 drug pairs. Drug pairs ranked by percentage of AP gene interactions. c, Heatmap representing effect of sgRNAs targeting KDM1A (encoding LSD1) and RCOR1/2/3 (n = 5 sgRNAs per gene) on ABT-199, cytarabine, decitabine and azacitidine; schematic depicts known relationship between genes identified in screen. d-f, GI50 values of azacitidine (d), cytarabine (e), and ABT-199 (f) in OCI-AML2 cells following CRISPR/Cas9 mediated knockout of KDM1A versus non-targeting control. g, Heatmap representing effect of sgRNAs targeting MYC, NSD2/3, EED, EZH2 (n = 5 sgRNAs per gene) on JQ-1 and ABT-199 from CRISPR/Cas9 screens; schematic depicts reciprocal effects of NSD2/3 and EED, EZH2 on their respective methylation marks and, indirectly, MYC. h-i, GI50 values of JQ-1 (h) and ABT-199 (i) following short-hairpin knockdown of MYC versus shGFP. j-k, GI50 values of JQ-1 (j) and ABT-199 (k) following overexpression of pCDH-MYC versus control vector. d-f; h-k, P-values computed by two-sided t-Test for equal means. Data are presented as mean ± SEM for n = 3 biologically independent experiments.

