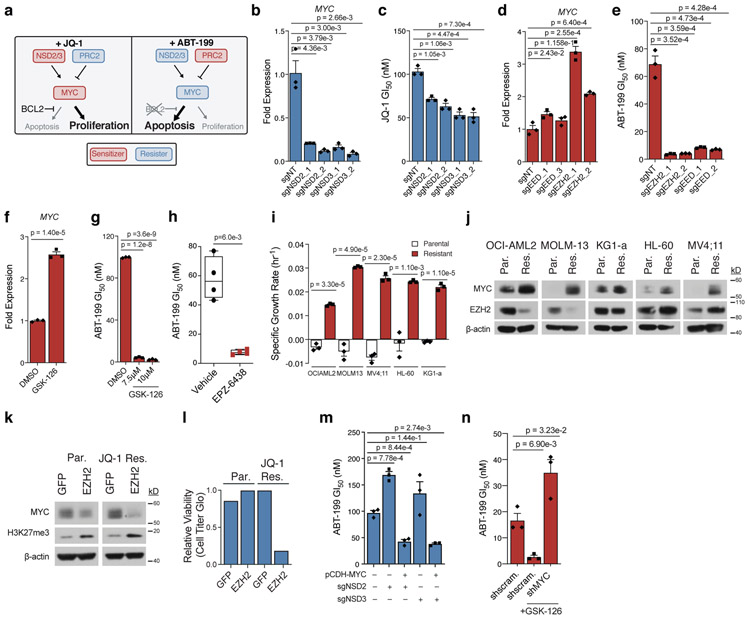
Figure 3: MYC and its epigenetic regulators are drug-induced AP genes.
a, Schematic depicting drug-dependent polarity of MYC axis, as defined by drug-modifier screens. b-c, Effect of sgRNAs targeting NSD2 or NSD3 versus non-targeting control in OCI-AML2 cells on MYC transcripts (b) and JQ-1 GI50 (c). d-e, Effect of sgRNAs targeting EED or EZH2 versus non-targeting control in OCI-AML2 cells on MYC transcripts (d) and ABT-199 GI50 (e). f, Fold-change of MYC transcripts following 48-hour treatment with EZH2 inhibitor GSK-126. g, ABT-199 GI50 combined with GSK-126 in OCI-AML2. h, ABT-199 GI50 values from drug naïve and EPZ-6438 relapsed AML PDX cells. hCD45+ blasts from whole bone marrow were subjected to 72-hour ABT-199 incubation. Significance determined by Welch’s two-sample t-Test. Boxplot elements defined in Methods. Data are mean ± SEM of n = 4 biologically independent animals. i, Specific growth rate in the presence of JQ-1 in matched parental and JQ-1 resistant AML cell lines. Representative growth rate of n = 4 independent samplings. j, Immunoblot analysis of MYC and EZH2 across matched parental (Par.) and JQ-1 resistant (Res.) AML cell lines. Representative immunoblot of n = 3 independent experiments. k, Immunoblot analysis of MYC and H3K27me3 following overexpression of GFP control and EZH2 in parental and JQ-1 resistant OCI-AML2 cells. Representative immunoblot of n = 3 independent experiments. l, Relative cell viability of parental and JQ-1 resistant OCI-AML2 cells following overexpression of GFP control or EZH2 for n = 1 biologically independent experiments. m, ABT-199 GI50 following overexpression of pCDH-MYC in NSD2/3 knockout cells. n, ABT-199 GI50 following short-hairpin knockdown of MYC versus scrambled control. b-g; i; m-n, P-values computed by two-sided t-Test for equal means. Data are mean ± SEM for n = 3 biologically independent experiments. Uncropped blots in Source Data.

