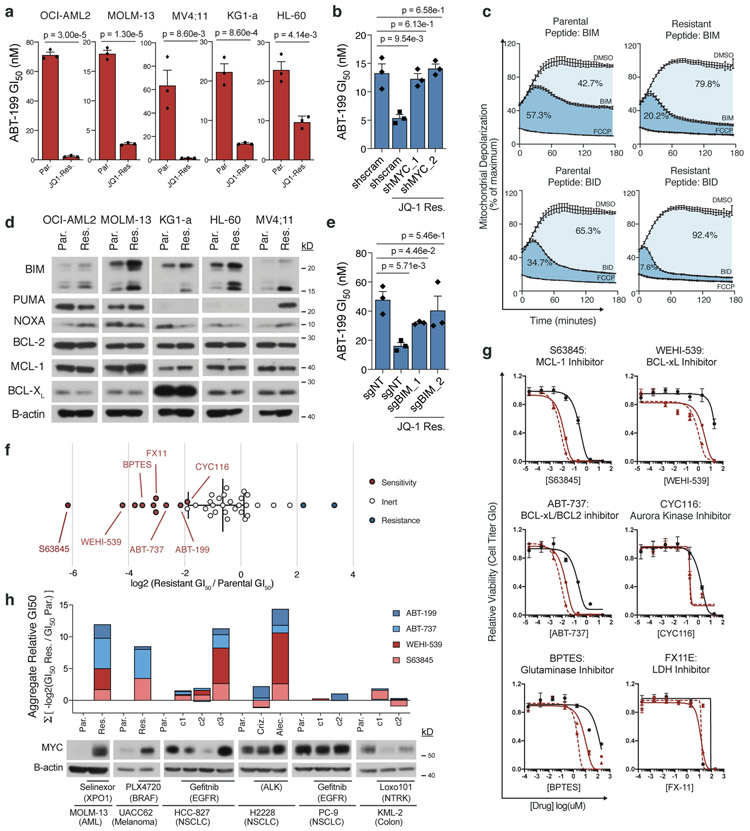
Figure 4: MYC upregulation enables a drug-induced evolutionary trap.
a, ABT-199 GI50 in matched parental and JQ-1 resistant AML cell lines. b, ABT-199 GI50 in parental and JQ-1 resistant OCI-AML2 cells following short-hairpin knockdown of MYC or scrambled control. c, BH3 profiling traces of parental and JQ-1 resistant OCI-AML2 cells stimulated with BIM or BID peptides. Mitochondrial potential was measured every 2 minutes over 3-hours. Percent depolarization relative to maximal depolarization by carbonyl cyanide-4-(trifluoromethoxy)-phenylhydrazone (FCCP). Data are mean ± SEM for n = 3 biologically independent experiments. d, Immunoblot analysis of BIM, PUMA, NOXA, BCL-2, MCL-1, and BCL-XL protein levels across matched parental and JQ-1 resistant AML cell lines. Representative immunoblot of n = 3 independent experiments yielding similar results. e, ABT-199 GI50 in parental and JQ-1 resistant OCI-AML2 cells following CRISPR/Cas9 knockout of BIM or non-targeting control. f, Log2-fold change in GI50 values from 40 compound screen of JQ-1-resistant OCI-AML2 cells relative to parental cells. g, Relative cell viability of matched parental and JQ-1 resistant OCI-AML2 cells following 72-hour incubation with indicated drugs across an 8-point drug dilution series. Data are mean ± SEM for n = 3 biologically independent experiments. h, Aggregate −log2(GI50) of drug-resistant versus parental cell lines, summed across four different BH3 mimetics. Distinct resistant clones marked c1-c3. Data are matched to corresponding MYC immunoblots. Representative immunoblots of n = 3 independent experiments yielding similar results. a-b; e, P-values computed by two-sided t-Test for equal means. Data are presented as mean ± SEM for n = 3 biologically independent experiments. Uncropped blots in Source Data.

