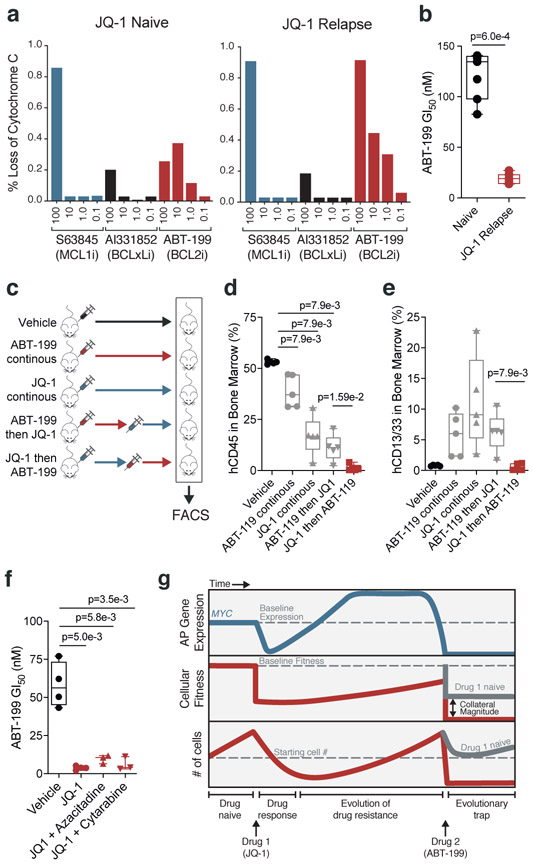
Figure 5: JQ-1 treatment primes PDX model of AML for treatment with ABT-199.
a, Release of cytochrome c upon drug stimulation in JQ-1 naïve and JQ-1 relapsed (50mg/kg, intraperitoneal injection) AML PDX cells. b, ABT-199 GI50 values from JQ-1 naïve and JQ-1 relapsed AML PDX cells. Significance determined by two-tailed Mann Whitney test for n = 5 biologically independent animals. c, Schematic depicting drug scheduling study in murine PDX model of AML treated with JQ-1 (50mg/kg, intraperitoneal injection) and/or ABT-199 (100mg/kg, oral gavage) according to indicated drug schedules. d-e, FACS quantification of human CD45+ (d) and human CD13/33+ (e) cells from murine bone marrow aspirates of mice in drug scheduling study. Significance determined by two-tailed Mann Whitney test. Data are presented as mean ± SEM for n = 4 biologically independent animals. f, ABT-199 GI50 values in AML PDX cells from treatment naïve versus mice with relapsed disease following treatment with JQ-1 alone or in combination with cytarabine (5mg/kg, intraperitoneal injection) and azacitidine (150mg/kg, intraperitoneal injection). Significance determined by two-tailed Mann Whitney test for n = 3 biologically independent animals. g, Proposed model for a chemotherapy-induced evolutionary trap. Treatment of AML cells with JQ-1 prompts compensatory upregulation of MYC, an AP gene that harbors pro-apoptotic potential. Subsequent treatment with ABT-199 produces a potentiated apoptotic response. b,d-f; Boxplot elements defined in Methods.

