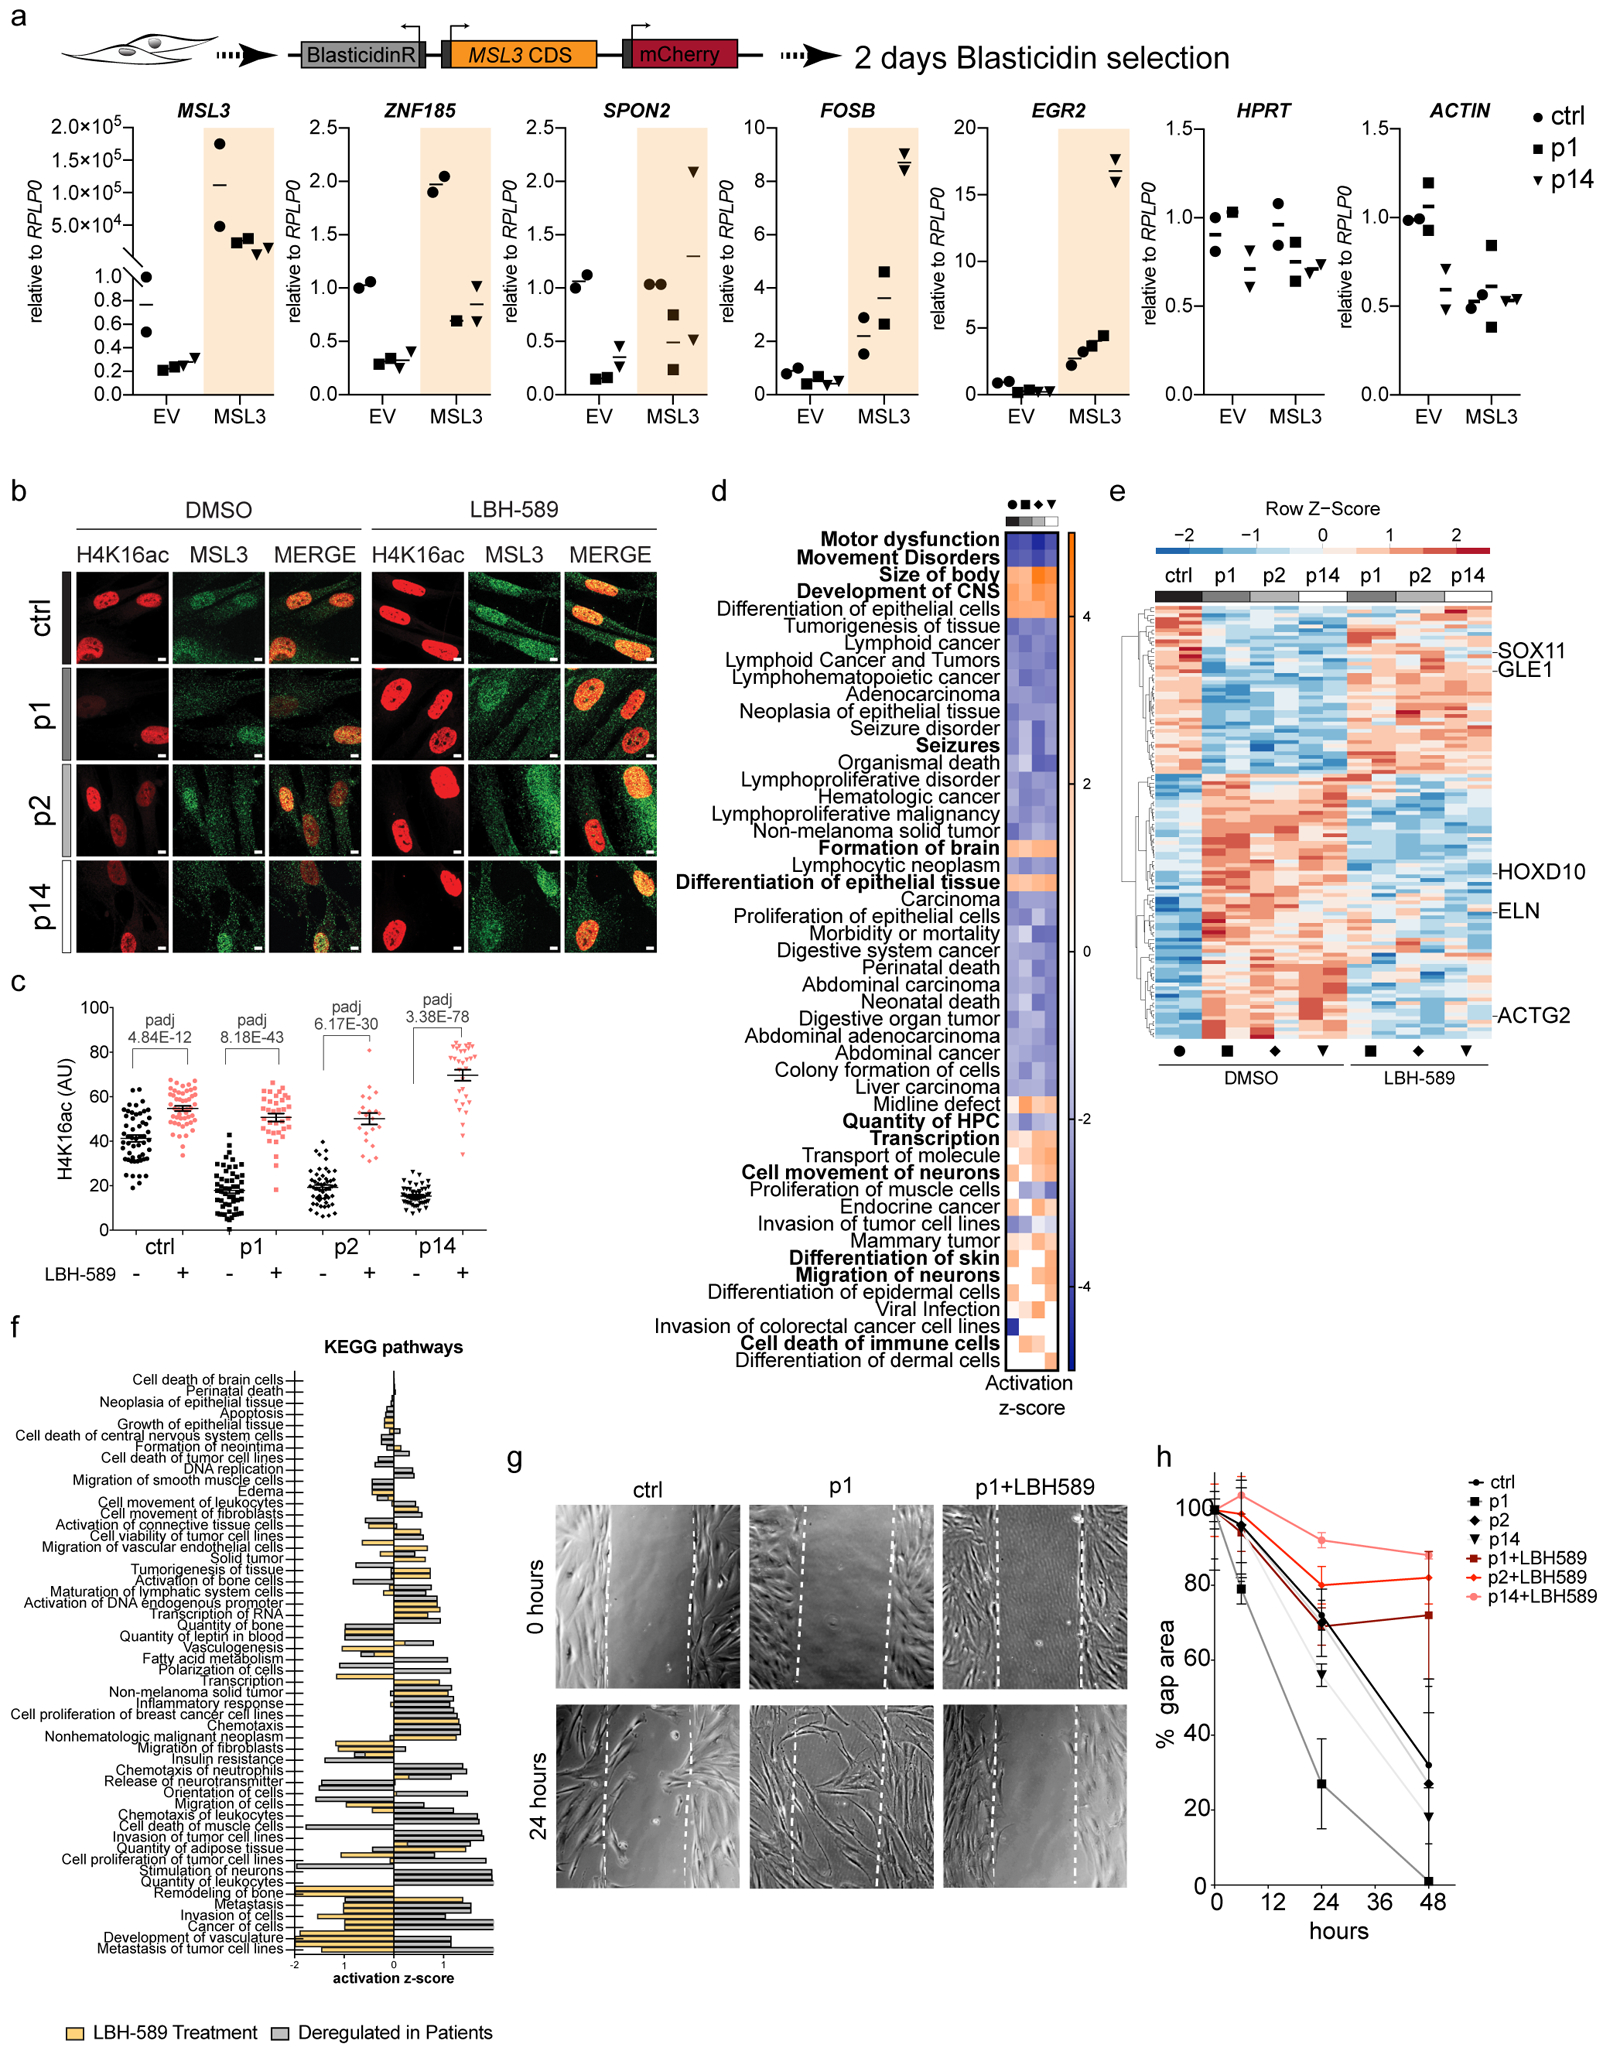
Figure 4. HDAC inhibition alleviates cellular and molecular phenotypes of MSL3 patient cells.

(a) MSL3 and empty expression vector (EV) were transfected in Control and p1/p14 HDFs. Dot plots depict RNA levels from each independent experiment normalized to RPLP0 relative to the EV. Center lines represent the mean (n = 2). CDS, protein coding sequence; BlasticidinR, blasticidin S resistance gene. (b) Immunofluorescence for H4K16ac (red) and MSL3 (green) on treatment with 4 μM LBH-589. Scale bar = 5 μm. The staining was reproduced twice. (c) Quantification of b. Data points represent H4K16ac intensities of individual cells from one representative experiment. Center lines represent the mean± s.e.m. P values were determined by ordinary one-way analysis of variance followed by Bonferroni correction. Detailed results of the statistical analyses are shown in Supplementary Table 5. (d) Heat map of activation z-scores obtained from IPA (comparison analysis; disease and function signature (n = 3,391 for the Control; n = 2,740 for p1; n = 2,487 for p2; n = 2,737 for p14; Padj < 1E−4 for differentially expressed genes on LBH-589 treatment (2 μM)). Activated pathways were plotted for |±z| > 2.5 and a log10[P value] cut-off of 1.5. Bold type shows the pathways impacting on patient cell physiology. CNS, central nervous system. Black circle, Control; square, p1; rhombus, p2 and triangle, p14. (e) Heat map representing z-scores of differentially expressed genes reverting to not differentially expressed on LBH-589 treatment (n = 109). Five disease-relevant transcripts are highlighted. Black circle, Control; square, p1; rhombus, p2 and triangle, p14. (f) IPA comparison analysis of KEGG pathway z-scores in genes rescued on LBH-589 (n = 109 with an expression cut-off of log ratio > |±0.2|). (g) Representative differential interference contrast images of HDFs at 0 and 24 h after creating a ‘scratch’ (gap area). (h) Quantification of the percentage gap area at 0, 6, 24, and 48 h for Control and patient HDFs grown with or without LBH-589 (2 μM). The center line represents the average ± s.e.m. (n = 3).
