
Figure 4.
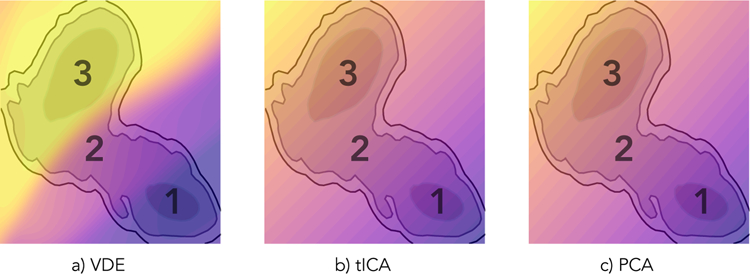
The 2-D Müller-Brown potential (gray-scale contours) overlaid with colormap projections of the one-dimensional a) VDE, b) tICA, and c) PCA coordinates. While tICA and PCA identify a strictly linear mode that approximates the slowest dynamical process (i.e. diffusion from region 1 to 3), the non-linear VDE is better able to map out basins (regions 1 and 3) and intermediate state (region 2). Note that because the region outside of the contours is energetically unfavorable, the color projections in that space are extrapolations of each method, respectively.